
If you’ve ever wondered how to use Google Trends for market research and whether it can actually give you an edge in the financial markets, buckle up — because this free tool is sitting right there under your nose, ignored by most traders, kind of like the gym membership you keep paying for but never use.
In my life, I’ve paid for Bloomberg terminals, fancy screeners, and subscriptions to newsletters written by people who sound smart but dress like they’re attending a Renaissance Fair. And then a colleague told me about Google Trends. Free. No subscription. No login. Just raw, publicly available data about what the entire world is searching for — in real time. I nearly knocked my coffee over.
This article is going to walk you through everything you need to know about how to use Google Trends for market research. We’re going to cover what it is, how it works, how traders and investors use it, real-world case studies, what the academic research says (yes, there are actual peer-reviewed papers on this — nerds have been studying it for years), and the mistakes that will make you look like a rookie. I’m going to make you laugh, teach you something genuinely useful, and hopefully save you from making the kind of financial decisions that require a long explanation to your accountant.
Let’s get into it.
What Is Google Trends — And Why Should a Trader Care?
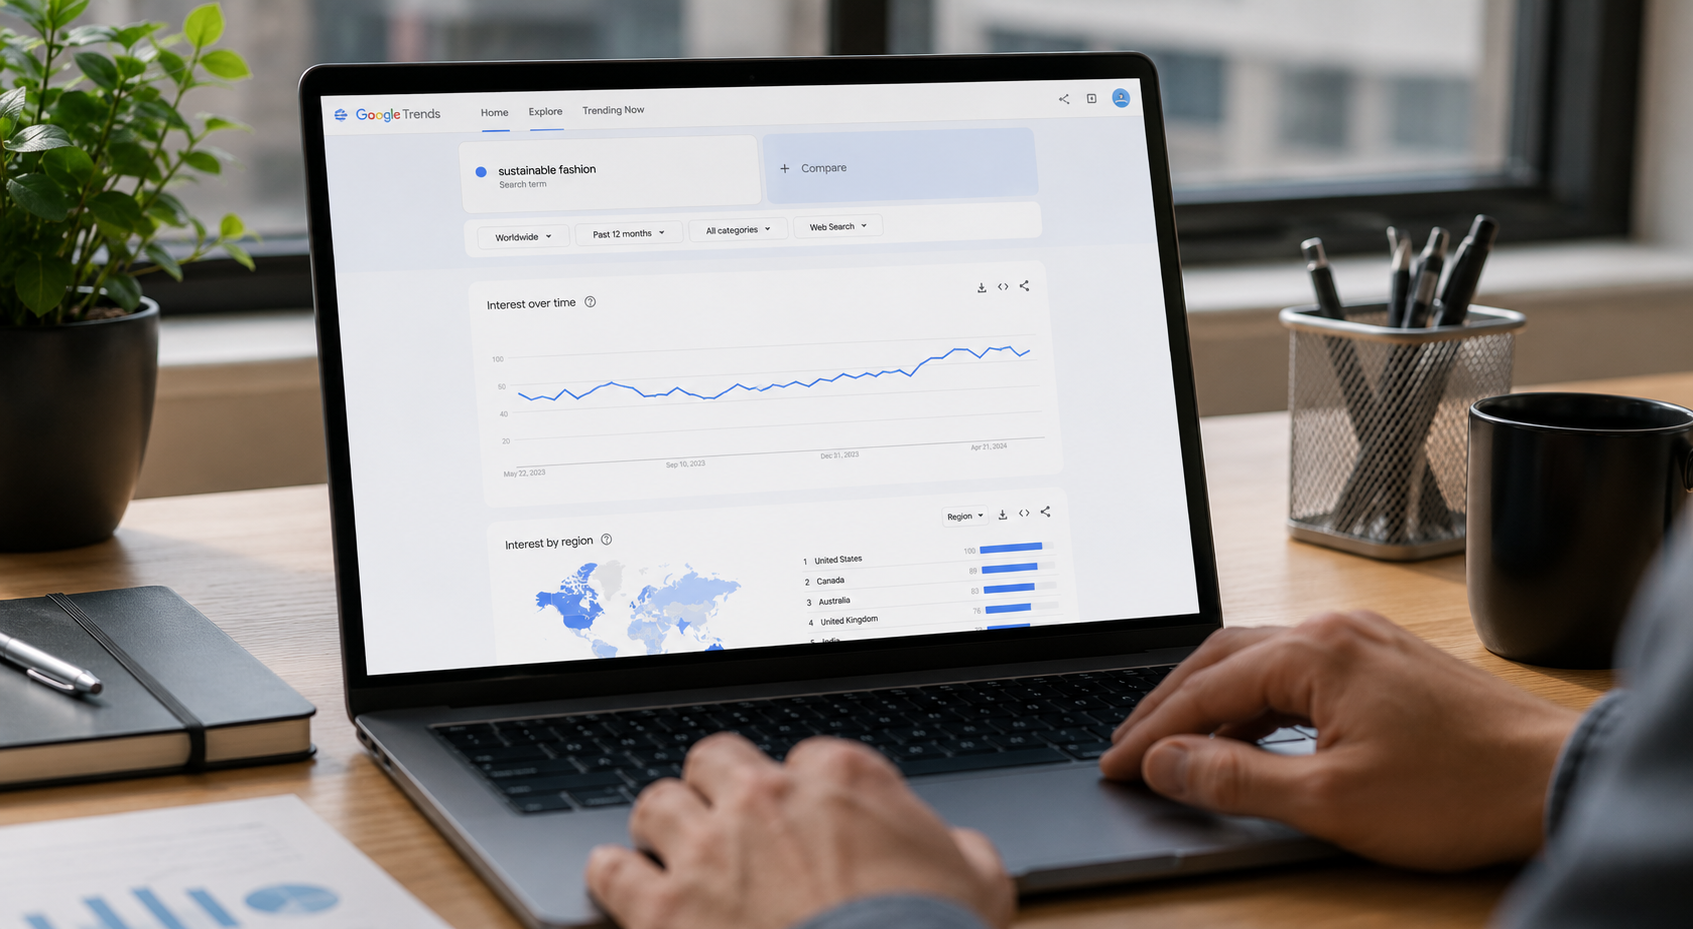
Google Trends is a free online tool provided by Google that analyses the popularity of search queries in Google Search across various regions and languages. It displays data on a normalised scale of 0 to 100, where 100 represents the peak search interest for a given term over the selected period, and 0 means the term was barely searched at all. Think of it as the mood ring of the internet — except instead of turning purple when you’re stressed, it turns into a spike when something is absolutely rocking the public’s attention.
Now, you might be thinking: “I’m a trader. Why do I care what people are googling?” And that is a fair question. The answer is simple: markets are driven by human behaviour. Human behaviour is driven by attention. And Google Trends tells you, in near real time, what the humans are paying attention to. If everyone suddenly starts googling “how to buy gold,” that’s not a coincidence — that’s a signal. If searches for “recession” spike, people are scared. If “meme stocks” trends go vertical, retail investors are loading up their Robinhood accounts, which either means a squeeze is coming or everyone’s about to lose their lunch money. Probably both.
The data is completely free. It works for any keyword. It covers over 200 countries. And it goes back to 2004. Tell me why you’ve been spending money on data subscriptions again?
The Academic Case: Google Trends Is Not Just for Millennials Searching for Brunch Spots
Before we get into the practical stuff, let me hit you with some science. Because if you walk into a boardroom and say “I use Google Trends,” the first person to roll their eyes deserves to know that published, peer-reviewed research has been validating this tool for over a decade.
The landmark study on this topic came from Preis, Moat, and Stanley (2013), published in Scientific Reports, titled “Quantifying Trading Behavior in Financial Markets Using Google Trends.” These researchers found that search volume data from Google Trends could be used to construct trading strategies that generated significant returns in the Dow Jones Industrial Average. They tested a strategy based on the hypothesis that increases in searches for financially relevant terms like “debt” and “portfolio” could predict downward market movements. Their results were striking — certain search terms appeared to function as early warning indicators of market declines. That study has since been cited hundreds of times. Hundreds. By people with PhDs. Using Google. For free.
Building on that, Ayala, Gonzálvez-Gallego, and Arteaga-Sánchez (2024) published a comprehensive systematic review titled “Google Search Volume Index and Investor Attention in Stock Market” in Financial Innovation (Springer). Their review synthesised decades of literature and concluded that Google Search Volume Index data is a reliable and significant proxy for investor attention, with demonstrated ability to forecast stock returns, volatility, and trading volume across multiple markets. In other words: it works. Not perfectly, not in isolation, but it works. And you’re not using it yet.
Then there’s the work of Kristoufek (2013), “BitCoin Meets Google Trends and Wikipedia: Quantifying the Relationship Between Phenomena of the Internet Era,” which showed that Bitcoin prices are significantly influenced by online search interest and that price movements often follow increases in public attention. Given that Bitcoin went from a curiosity to a $1 trillion asset class, perhaps we should listen to what the search data was screaming all along.
I’m not saying Google Trends is the holy grail. What I’m saying is that people smarter than both of us — people who get grants and publish in journals and presumably have offices with whiteboards covered in equations — have looked at this tool and said, “Yeah, this matters.” So maybe give it a shot before dismissing it as something your teenage nephew uses to figure out what songs are trending.
How Google Trends Actually Works: The Basics You Need to Know
Let me walk you through the tool so you don’t spend twenty minutes staring at it like it insulted your mother.
Step 1: Go to trends.google.com. That’s it. No account needed. No credit card. Nothing. You’re already doing better than the guy who paid five thousand dollars for a trading course that taught him the same thing.
Step 2: Enter your keyword. You can compare up to five keywords at once. This is where the magic happens. Instead of searching for one term, compare competitors, compare related concepts, compare your stock against a peer. For example, compare “buy Apple stock” against “buy Microsoft stock” and see which one is getting more retail attention right now.
Step 3: Filter your results. You can filter by:
- Time period — from the past hour to 2004. For trading, the past 90 days, past 12 months, and 5-year views are all useful for different purposes.
- Geography — global, country-level, or even city-level. This is incredibly powerful for regional demand analysis.
- Category — you can filter searches specifically within Finance, Business, or Shopping. This removes noise from unrelated searches with the same keywords.
- Search type — Web Search, Image Search, News Search, Google Shopping, or YouTube Search. Each of these tells a different story about where the interest is coming from.
Step 4: Read the data correctly. Remember, the data is normalised, not absolute. A score of 100 doesn’t mean a hundred searches happened — it means that point in time had the highest relative search volume in your selected period. The actual numbers are not disclosed. This is important: you’re looking at trends and relative changes, not absolute volumes. The slope of the line and the direction of momentum matter far more than any single data point.
Step 5: Use the “Related Queries” and “Related Topics” sections. This is the feature that most people completely ignore, and it is arguably the most valuable part. Related Queries shows you what else people are searching for alongside your keyword, and “Rising” shows you what’s growing fastest. As a trader, this section is basically a peek into the collective subconscious of the market. If you search “oil price” and the rising related queries include “energy stocks” and “OPEC production cut,” that’s your crowd sentiment mapped out in front of you.
Five Specific Ways Traders Use Google Trends for Market Research
1. Gauging Retail Investor Attention Before a Move
Here’s a pattern that comes up repeatedly in the research: retail investors google things before they buy them. Sounds obvious, but the implications are enormous. When search volume for a stock or sector spikes, it often precedes a price move — particularly in assets dominated by retail participation.
A study examining nearly 200 publicly traded US retailers from 2004 to 2019 found that rising search volumes frequently preceded revenue growth before analysts or investors had formally responded. Investment strategies based on Google Trends data delivered returns 2–3% above traditional models. Now listen, I know what you’re thinking: “Two to three percent doesn’t sound like much.” You say that until you’re managing a multi-million pound portfolio and two percent becomes a very nice number indeed. And you didn’t have to hire a single analyst. Just you and Google. Free.
The practical application: track searches for the companies or sectors you follow. Set up a recurring check — weekly at minimum. If you start seeing search volume trending up steadily while the price hasn’t moved yet, that’s worth investigating further. Not buying blindly — investigating. Like a detective. A very financially motivated detective.
2. Identifying Market Tops Through Search Frenzy
This one is counter-intuitive and it’s where so many retail traders get obliterated. When a stock or asset hits peak search volume, it often means everyone already knows about it — including the people who are about to sell to you.
Look at Bitcoin in December 2017. Google searches for “Bitcoin” hit an all-time high. Price followed shortly after — and then crashed approximately 80%. Searches for “Bitcoin” peaked again in late 2021. Price peaked. Then cratered. The pattern is not perfect, but it is consistent enough to treat peak Google Trends interest as a yellow flag, not a green light.
This is what the research calls “attention-driven” investing — retail investors piling into assets because they’re hearing about them everywhere, which creates overvaluation. By the time something is trending on Google, it’s often already trending in the wrong direction for the late buyer. As one researcher put it, when search popularity soars, retail investors often enter the market en masse and the asset price may be close to a high point. Caution is required.
I call this the “your barber is buying it” indicator. When your barber, your Uber driver, and your mum’s book club are all googling the same stock, that’s not a signal to buy. That’s a signal to be very, very careful about what’s already priced in.
3. Sector Rotation and Macro Theme Research
One of the most powerful and under-used applications of Google Trends for market research is tracking macro themes before they show up in price action. Think about this: before a sector rallies, consumer interest typically builds. Before a sector rotates out of favour, searches slow down and die quietly like a plant you forgot to water.
For example, tracking searches for “electric vehicle” or “EV stocks” against “hybrid cars” over a five-year window gives you a picture of the structural demand shift that the entire automotive industry is navigating right now. According to StartUs Insights, search patterns for “electric SUV” mirror a projected 31.9% compound annual growth rate toward a massive multi-trillion dollar market by 2030. These trends don’t appear from nowhere — they build slowly and then accelerate, exactly the way a good investment thesis builds before the market rewards it.
This is macro research on a budget. Not Bloomberg budget. Not “I have a research team” budget. Just you, your browser, and the willingness to look at a line graph without crying.
4. Geographic Demand Analysis
This is where Google Trends becomes genuinely extraordinary and most people don’t bother. You can break down search interest by country, state, or even city. For traders and investors in specific sectors — retail, real estate, energy, consumer goods — this geographic data is gold.
Say you’re assessing a US regional retailer’s prospects in the Sun Belt. Pull up Google Trends, filter by the relevant states, and look at whether interest in the retailer’s products or sector is rising or falling regionally. If searches for “home renovation” are spiking in Florida and Texas but falling in the Northeast, that’s relevant to your thesis on home improvement retail stocks.
The academic literature on this is also compelling. A 2020 study in the International Real Estate Review, “Can Google Search Data Be Used as a Housing Bubble Indicator?” by Oust and Eidjord, demonstrated that Google search data could be effectively used to identify regional housing bubbles before they fully inflated. For real estate investors and REITs traders, this is the kind of regional, real-time intelligence that used to cost a fortune.
5. Competitive Intelligence and Brand Health Monitoring
Every listed company has a brand, and brand health shows up in search data. As a trader, tracking the relative search interest of competitors tells you something about where the market’s mindshare is shifting — often before it shows up in earnings or analyst reports.
According to research across 30 case studies in 12 categories and seven countries, the share of search accounts for approximately 83% of actual market share on average. That’s a striking relationship. If you can see one brand steadily gaining ground in search interest relative to its competitor, you’re potentially seeing tomorrow’s market share shift today.
Run this exercise: compare “Netflix” versus “Disney Plus” versus “Apple TV” in Google Trends over the past three years. The lines tell a story about subscriber growth and market position that’s directionally consistent with what actually happened to those companies’ share prices and subscriber numbers. You didn’t need a research report. You needed five minutes and the ability to read a chart.
Case Study 1: Bitcoin and the Google Trends Signal
Let’s look at one of the most studied examples in the academic literature: Bitcoin.
Researchers Aslanidis, Bariviera, and López (2022), in their paper “The Link Between Cryptocurrencies and Google Trends Attention,” published in Finance Research Letters (Elsevier), found a bidirectional flow of information between Google Trends attention and cryptocurrency returns lasting up to six days. This means that not only does price action influence searching behaviour, but search behaviour influences future price action. It runs both ways. That’s a feedback loop, and feedback loops create momentum — the bread and butter of trend trading.
The practical implication: when Google Trends data for “Bitcoin” starts rising before a noticeable price move, it often gives you a one-to-six-day advance warning. Not a guarantee. Not investment advice. A signal to pay closer attention.
During the 2020–2021 bull cycle, searches for “Bitcoin” started climbing steadily from September 2020, well before the mainstream media started covering the run-up to the December 2020 highs. Traders watching Google Trends had context. Traders not watching it were reading the same headlines as everyone else and buying into the excitement at exactly the wrong time. It’s not about being right every time. It’s about having more information than the person on the other side of your trade.
Case Study 2: The 2023 US Banking Crisis
In 2023, when Silicon Valley Bank collapsed, Google searches for “bank collapse,” “bank run,” and “FDIC insurance” spiked dramatically. Researchers Lyócsa, Halousková, and Haugom (2023), in their paper “The US Banking Crisis in 2023: Intraday Attention and Price Variation of Banks at Risk,” published in Finance Research Letters, documented how intraday attention patterns in Google search data preceded price declines in vulnerable regional banking stocks.
What this means in plain terms: the public panic was measurable, quantifiable, and directionally predictive before most traditional indicators picked it up. If you were monitoring Google Trends for banking-related keywords in early March 2023, you had a front-row seat to the fear building in real time. That’s not trading on inside information. That’s reading publicly available, freely accessible data — which somehow the majority of market participants weren’t doing.
The lesson: during crisis events, Google Trends is one of the fastest sentiment indicators available. Faster than many news aggregators. Faster than waiting for official statements. The public reacts before institutions do, and their reactions show up in search data immediately.
Case Study 3: Retail Demand Forecasting for Consumer Stocks
A study published examining publicly traded US retailers found that rising Google search volumes for product categories consistently preceded measurable revenue growth, often by one to two quarters. For consumer discretionary stock pickers, this creates an interesting opportunity: monitor search interest in the products that drive revenue for the companies you’re researching.
For example, if you hold positions in athletic wear companies, track searches for “running shoes,” “gym membership,” “home gym equipment,” and adjacent terms. When these start trending up, you’re seeing early demand signals. When they fall, the consumer is pulling back — and that often shows up in the next earnings call, which you saw coming and they didn’t.
This isn’t magic. It’s just paying attention to what the customers of the companies you invest in are actually doing online — which is a reasonable proxy for what they’re planning to buy.
The Limitations: Because I’d Be a Terrible Trader If I Didn’t Tell You the Downsides
Look, nothing in this game is perfect. If it were, we’d all be retired already. Google Trends has some real limitations that you need to understand before you go building a trading strategy purely around it.
Normalised data, not absolute. You cannot see exact search volumes. You see relative popularity. This means you can miss the magnitude of a trend — two separate spikes might look the same on the chart but represent wildly different levels of absolute interest.
It can be noisy. Seasonal patterns, news events, and viral moments can cause spikes that have nothing to do with fundamental market dynamics. If a celebrity mentions a stock on television, searches will spike for reasons that have no bearing on the company’s actual value. Chasing every spike will get you hurt.
Correlation is not causation. The research consistently shows a relationship between search data and market outcomes, but it’s probabilistic, not deterministic. Preis et al. (2013) themselves noted the importance of keyword selection and the risk of data mining biases. Challet and Bel Hadj Ayed, in their paper “Predicting Financial Markets with Google Trends and Not So Random Keywords,” specifically warned about the subtle biases that can affect backtesting strategies based on search data. Any strategy you build needs to account for these biases rigorously.
It works best in combination. The strongest signal comes when Google Trends data corroborates what you’re seeing in price action, fundamentals, and other sentiment indicators — not when it’s operating in isolation. As the researchers at QuantPedia found, combining Google Trends sentiment with price trend signals significantly outperforms using either alone.
And finally: just because everyone is googling something does not mean you should trade it. People googled “get rich quick scheme” a lot during the meme stock frenzy of 2021. That does not mean you should have bought GameStop at $400. I’m saying this with the full weight of someone who watched that happen in real time, jaw on the floor, watching grown adults treat the stock market like a lottery that pays out if you believe hard enough.
Combining Google Trends with Your Existing Research Stack
The real power of Google Trends for market research emerges when you layer it on top of your existing analytical framework. Here’s how to think about integration:
Quantitative traders: Google Trends data is available for download as a CSV. You can incorporate it as a feature in a machine learning model alongside price data, volume, and volatility metrics. Research published in Financial Innovation (Springer, 2024) showed that LSTM models incorporating Google Trends data significantly outperformed traditional forecasting models for ETF price prediction, reducing mean absolute percentage error by 22–49.7%. If you’re building systematic strategies, this data belongs in your feature set.
Fundamental analysts: Use Google Trends as a real-time demand barometer. When you’re building a revenue model, the search interest in a company’s core product category is a leading indicator that doesn’t show up in any financial statement. Build it into your due diligence process. Add a five-minute Google Trends check to every investment thesis you write.
Macro traders: Track searches for macro keywords — “inflation,” “interest rates,” “recession,” “central bank,” “dollar strength” — across geographies. The geographic breakdown gives you insight into where economic concern is building or receding before official data is published. Searches for “unemployment” in a particular country rising sharply is often a leading indicator of the official data release to come.
Swing traders and technical analysts: Use Google Trends as a sentiment overlay on your technical setups. A breakout from a technical pattern carries more conviction when it’s accompanied by rising search interest in the underlying asset. Conversely, a breakout on declining search interest might be a trap. Use the data as confirmation, not the primary signal.
A Step-by-Step Workflow for Using Google Trends in Your Weekly Market Research
Here is a practical weekly routine that won’t take more than thirty minutes and will put you meaningfully ahead of most retail investors:
Monday morning — Macro check: Pull up Google Trends and search for macro terms relevant to your portfolio: “recession,” “inflation,” “oil price,” “interest rates.” Look at the past 90-day trend. Are searches rising, falling, or stable? Note anything unusual.
Mid-week — Sector and position check: Run your top five positions or sectors through Google Trends. Compare them against their closest competitors. Is search interest growing or declining relative to competitors? Has there been any unusual spike this week that you need to research further?
End of week — Rising queries audit: Go to each of your key searches and check the “Rising” related queries section. Look for emerging themes you weren’t tracking. New terms appearing in the rising queries can signal shifts in public interest before they show up anywhere else.
Monthly — Geographic deep dive: Once a month, add a geographic layer to your most important themes. Look at where interest is growing strongest by region. This is particularly useful for US-listed companies with significant regional revenue concentration.
Quarterly — Long-term trend audit: Once per quarter, pull up the 5-year chart for your key themes. Are you riding a structural trend or a cyclical spike? Google Trends will show you both, and knowing which one you’re in changes your holding period and position sizing dramatically.
Advanced Features You Might Not Know About
Google Trends + BigQuery: Google makes its Trends data available through Google BigQuery at the Nielsen Designated Market Area level, which includes retail-level regional granularity. If you have the technical capability to run SQL queries, this unlocks a level of geographic detail that is extraordinary for consumer-facing investment research.
YouTube Search vs Web Search: Filtering by YouTube search gives you a completely different picture from web search. YouTube trends skew younger and tend to reflect entertainment-driven interest rather than research-driven intent. For certain consumer brands, tracking YouTube search interest is a more accurate proxy for brand enthusiasm among younger demographics.
Embed and export: You can export any Google Trends dataset as a CSV, embed charts into presentations, and share direct links. For research presentations to colleagues or investment committees, being able to show the search trend alongside your price chart adds a dimension of evidence that is compelling and visually immediate.
Real-time data: For breaking news events, Google Trends’ hourly data is available for the past week. This means that during a market crisis or major news event, you can monitor the public’s reaction in near real time, which is genuinely valuable for volatility traders.
Common Mistakes Traders Make with Google Trends
Chasing spikes without context. A spike in search interest is only interesting if you understand why it happened. News-driven spikes often reverse. Organic, slowly building interest is far more meaningful than a vertical jump caused by a single viral moment.
Ignoring seasonality. Some keywords spike every single year at the same time, and it means nothing. “Tax return” spikes every April. “Christmas gifts” spikes every November. Always compare year-over-year to separate genuine trend changes from seasonal patterns.
Over-relying on a single keyword. Use related queries to build a cluster of keywords around your theme. A single keyword can mislead. A cluster of related keywords telling the same story is far more reliable.
Forgetting the normalisation issue. If you compare a huge keyword like “stock market” with a niche keyword like a small-cap stock ticker, the niche term will almost always look flat because its search volume is tiny relative to the bigger term. Use comparison terms of similar magnitude.
Not combining it with anything else. This is the big one. Google Trends alone is not a trading strategy. It is one signal among many. The traders who benefit from it are those who use it to sharpen and confirm their existing analysis, not those who build their entire framework around it.
How to Set Up Google Trends Alerts So You Don’t Have to Remember to Check
One thing I’ve noticed about traders — including myself, and I say this with the full weight of self-awareness — is that we set up incredibly complicated systems to monitor the exact things we care about, and then we completely forget to check them. We’ll build a watchlist of 200 stocks, pay for a news aggregator, and then spend the morning scrolling social media because it’s more entertaining. This is fine. This is human. But let’s at least try to be automated about it.
Google doesn’t offer native “alerts” from Trends the way it does with Google Alerts, but here’s a workaround that takes five minutes to set up. Create a Google Alert for any keyword you’re tracking in Trends. Google Alerts will email you whenever that term spikes in news coverage. The combination of Alerts (for news spikes) and Trends (for search volume) gives you a two-layer early warning system. When both fire at the same time — when news coverage and search interest are both rising simultaneously — that’s the moment worth your focused attention.
You can also use IFTTT or Zapier to create automated workflows triggered by certain conditions. For serious systematic traders, the Google Trends data is available in bulk through the BigQuery public dataset, meaning you can write automated monitoring scripts that alert you when any tracked keyword crosses a threshold of your choosing. No more manual checking. No more forgetting. Just clean, automated intelligence landing in your inbox while you’re doing other things — like convincing yourself that reading financial Twitter counts as research.
Build a system. The traders who consistently benefit from Google Trends are the ones who built a routine that checks it automatically. Discipline plus automation equals the kind of edge that survives contact with a real market.
The Bottom Line: Google Trends Is Free Alpha, and You’re Leaving It on the Table
Let me land this plane clearly: Google Trends for market research is one of the most underutilised tools available to individual traders and investors. It is free. It is real-time. It covers the world. It has been validated by over a decade of peer-reviewed academic research across multiple asset classes and geographies. And the majority of your competition — the other retail investors in the market — is not using it.
That is an edge. It’s not a guaranteed edge. Nothing in markets is guaranteed except commissions, taxes, and the occasional existential crisis at three in the morning. But it’s a real, measurable, academically validated signal that costs you nothing except thirty minutes a week of your time.
The research is clear: from Preis et al.’s foundational work on predicting market behaviour through search data, to Ayala et al.’s 2024 systematic review confirming Google Search Volume Index as a reliable investor attention proxy, to Aslanidis et al.’s findings on the bidirectional information flow between Google Trends and cryptocurrency markets — the tool has earned its place in the serious investor’s toolkit.
You don’t have to be a quant. You don’t need a Bloomberg terminal or a PhD in financial econometrics. You need a browser, a keyword, and the discipline to look at the data every week without letting your emotions override what it’s telling you.
The market is full of people making decisions based on vibes, headlines, and tips from people they met at a barbecue. You now know about a free, research-validated tool that gives you a direct window into what millions of people are thinking and searching for in real time. What you do with that information is entirely up to you.
Just don’t come back to me in six months saying the market is unpredictable. It is. But it’s slightly less unpredictable when you know where the crowd is looking before the crowd does anything about it.
Now go open Google Trends. It’s already been a free tab in your browser this whole time.
References
- Preis, T., Moat, H. S., & Stanley, H. E. (2013). Quantifying Trading Behavior in Financial Markets Using Google Trends. Scientific Reports, 3, 1684. https://www.nature.com/articles/srep01684
- Ayala, M. J., Gonzálvez-Gallego, N., & Arteaga-Sánchez, R. (2024). Google search volume index and investor attention in stock market: a systematic review. Financial Innovation, 10(1), 1–29. Springer. https://link.springer.com/article/10.1186/s40854-023-00606-y
- Aslanidis, N., Bariviera, A. F., & López, Ó. (2022). The link between cryptocurrencies and Google Trends attention. Finance Research Letters, 47, 102654. Elsevier. https://www.sciencedirect.com/science/article/pii/S1544612321005833
- Kristoufek, L. (2013). BitCoin Meets Google Trends and Wikipedia: Quantifying the Relationship Between Phenomena of the Internet Era. Scientific Reports, 3, 3415. https://www.researchgate.net/publication/259154514_BitCoin_meets_Google_Trends_and_Wikipedia_Quantifying_the_relationship_between_phenomena_of_the_Internet_era
- Challet, D., & Bel Hadj Ayed, A. (2013). Predicting Financial Markets with Google Trends and Not So Random Keywords. arXiv preprint. https://arxiv.org/pdf/1307.4643
- Szczygielski, J. J., Charteris, A., Obojska, L., & Brzeszczyński, J. (2024). Google search trends and stock markets: Sentiment, attention or uncertainty? International Review of Financial Analysis, 91. Elsevier. https://ideas.repec.org/a/eee/finana/v91y2024ics1057521923000650.html
- Oust, A., & Eidjord, O. M. (2020). Can Google Search Data be Used as a Housing Bubble Indicator? International Real Estate Review, 23(2), 893–934. https://ideas.repec.org/p/hal/wpaper/hal-00851607.html
- Lyócsa, Š., Halousková, M., & Haugom, E. (2023). The US banking crisis in 2023: Intraday attention and price variation of banks at risk. Finance Research Letters. Elsevier. https://ideas.repec.org/a/eee/finana/v91y2024ics1057521923000650.html
- Goodell, J. W., Kumar, S., Li, X., Pattnaik, D., & Sharma, A. (2022). Foundations and research clusters in investor attention: Evidence from bibliometric and topic modelling analysis. International Review of Economics & Finance, 82(C), 511–529. https://ideas.repec.org/a/spr/fininn/v10y2024i1d10.1186_s40854-023-00606-y.html
- StartUs Insights. (2025). How to Use Google Trends for Market Research. https://www.startus-insights.com/innovators-guide/how-to-use-google-trends-for-market-research/
Disclaimer: This article is for informational and educational purposes only. It does not constitute financial or investment advice. Trading and investing involve significant risk of loss. Always conduct your own research and consult a qualified financial professional before making investment decisions.
Leave a Reply
You must be logged in to post a comment.