
Every founder who has ever pitched an investor has needed to understand TAM, SAM, and SOM — the three market-sizing metrics that separate the funded from the forgotten, the visionaries from the daydreamers, and the boardroom rockstars from the people crying in their cars in the Starbucks car park.
I’ve sat across the table from founders pitching ideas that sounded like they were going to revolutionise the universe, only to ask them one simple question — “What’s your TAM?” — and watch the whole thing fall apart like a wet napkin in a monsoon. The blank stares. The throat-clearing. The nervous glance at their co-founder as if to say, “Did you memorise this part?” Nobody memorised this part.
So this guide is for you. The builder. The dreamer. The person who has a WhatsApp group called “Team Revolution” with three members and zero revenue. I’m going to walk you through Total Addressable Market (TAM), Serviceable Addressable Market (SAM), and Serviceable Obtainable Market (SOM) in plain English. No jargon. No condescension. Just truth, a little tough love, and enough jokes to keep you from falling asleep.
Why Market Sizing Matters (And Why Most Founders Get It Wrong)
Before we get into definitions, let me set the scene. Imagine you walk into a pitch meeting and you tell a venture capitalist that your new food delivery app is going after “the entire global food market, worth $9 trillion.”
My guy. My absolute guy.
That’s like saying you’re going to date everybody on the planet because technically you’re all on the same planet. Technically correct. Practically insane. You don’t have the operational capacity. You’re not going to get a date from Mars. Sit down.
Market sizing is one of the most important analytical exercises a founder can perform. It is not just a slide in your pitch deck. It is the foundation of your go-to-market strategy, your fundraising narrative, your hiring plan, and your long-term vision. Get it wrong and investors will smile politely and send you a rejection email with the subject line: “Following up on our great conversation.” (Spoiler: it was not a great conversation.)
Academic research backs this up with hard data. Da Rin, Hellmann, and Puri’s landmark “Survey of Venture Capital Research” — published in the Handbook of the Economics of Finance — found that venture capitalists consistently weigh market size and market opportunity among the top three criteria when evaluating early-stage investments, alongside team quality and product differentiation. [1] This isn’t anecdotal. This is decades of empirical evidence telling you that if you can’t talk about your market intelligently, you are leaving money on the table and walking home on the bus.
Furthermore, Gu, Qian, and Lu’s 2018 study in the International Entrepreneurship and Management Journal demonstrated that startups with well-defined market positioning — underpinned by rigorous market sizing — were significantly more likely to attract venture capital and achieve meaningful growth milestones compared to those relying on vague or inflated market claims. [2] Translation: know your numbers or know your exit. The door, that is. Not the profitable kind.
The Three Circles: TAM, SAM, SOM Explained
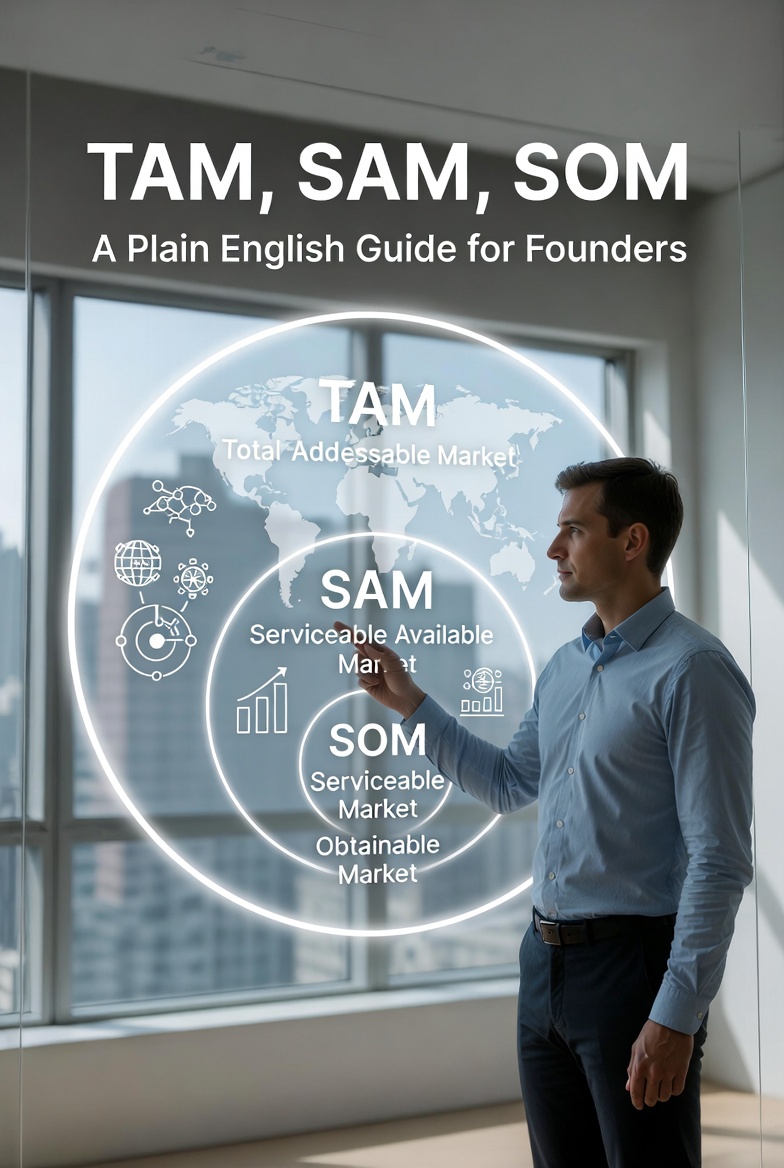
Think of TAM, SAM, and SOM as three concentric circles. TAM is the biggest circle — the whole universe. SAM is the middle circle — the part of the universe you can actually reach. SOM is the smallest circle — the part you can realistically grab in the near term.
Easy enough, right? Let’s break them down one by one.
TAM — Total Addressable Market
TAM is the total revenue opportunity available if your product achieved 100% market share, globally, with zero competition and zero constraints.
It’s the dream number. The big, beautiful, “mama we made it” number that gets investors leaning forward in their chairs. It represents the theoretical upper ceiling of your market.
Here’s the trader’s honest take: TAM is also where founders get the most delusional. There’s a species of founder — and I’ve met this species many times — who calculates their TAM by adding up every tangentially related market on Earth and calling it a day. They’ll say something like, “The global wellness market is worth $6 trillion, the global tech market is worth $5 trillion, the global food market is worth $9 trillion — and since our app combines all three, our TAM is $20 trillion.”
Bro. My brother in entrepreneurship. You cannot just add markets together like you’re doing a grocery shop. That’s not how this works. That’s not how any of this works.
A properly calculated TAM uses one of two methodologies:
1. Top-Down Analysis: You start with a large industry figure from a credible source — Gartner, McKinsey, IBISWorld, government statistics — and then narrow it down to your specific segment. For example: “The global CRM software market is $70 billion. Small-business CRM represents approximately 28% of that, giving a TAM of roughly $19.5 billion.” This is fast, useful, and gives investors context. Just make sure your source is credible. “My uncle said” is not a valid source.
2. Bottom-Up Analysis: You build from the ground up. You estimate the number of potential customers, multiply by your average revenue per user (ARPU), and that gives you your TAM. For example: “There are 500,000 independent coffee shops in the United States. Our software costs $200 per month per shop. That’s a TAM of $1.2 billion annually.” This method is more time-intensive but significantly more credible to savvy investors.
As Warner’s widely-cited analysis in Medium on effective market sizing for startups and VCs explains, best practice is to apply both methods and cross-validate your estimates — because if your top-down number and bottom-up number are in the same ballpark, you’ve got a credible TAM. If they’re wildly different, one of your assumptions is broken and you need to figure out which one before someone else does. [3]
Case Study: Airbnb’s TAM
When Airbnb pitched investors in the early days, their TAM was the global travel and hospitality market, estimated at over $500 billion annually. Did they think they’d capture all of it? Of course not. But the size of the TAM told investors: this is a big enough sandbox to build a serious company in. They weren’t pitching a niche product for a tiny market. They were pitching a platform capable of disrupting an enormous, entrenched industry. And the rest, as they say, is history. (And Superhost status for your quirky Airbnb with the wall murals and the “help yourself” kombucha in the fridge.)
SAM — Serviceable Addressable Market
SAM is the portion of the TAM that you can realistically serve, given your product capabilities, geographic reach, pricing model, and target customer segment.
This is where reality politely taps TAM on the shoulder and says, “Okay, big guy, sit down. We need to talk about what’s actually achievable.”
Your SAM answers the question: “Of all the people in this enormous market, which ones can I actually reach and serve right now?”
Let me give you an analogy. You’re a chef. Your TAM is every hungry human on the planet — approximately 8 billion people. But your restaurant is a 40-seat Caribbean spot in Leeds, England, open Tuesday through Sunday, 5pm to 10pm. You’re not serving all 8 billion people. You’re not even serving all of Leeds. You’re serving the people who live nearby, like Caribbean food, are available during your opening hours, and can afford your prices. That’s your SAM.
Calculating SAM means applying real-world filters to your TAM:
- Geography: Where do you actually operate? Are you UK-only? US-only? Europe?
- Demographics: Who is your actual target customer? Age, income, occupation, behaviour?
- Pricing: At your price point, who can and will pay?
- Product fit: Does your product actually solve the problem for everyone in the TAM, or just a subset?
If your TAM is the global CRM market at $19.5 billion, your SAM might be the UK-based small business CRM market at $900 million. That’s still a massive number. And it’s a number you can defend with data, research, and a straight face — which is more than most founders can say.
Research from Parul University’s entrepreneurship programme — cited in a 2026 curriculum study on startup market sizing — emphasises that SAM calculation demands genuine discipline: founders must apply their geography, pricing, and business model as genuine constraints, not aspirational targets. The study found that student founders who calculated SAM rigorously (using real constraints) produced business plans that attracted significantly more mentor and investor interest than those who treated SAM as a slightly smaller version of TAM. [4]
Now here’s the thing about SAM that nobody tells founders. A well-defined SAM is actually more impressive to a sophisticated investor than an inflated TAM. Why? Because it shows you understand your customer. It shows you’ve done the work. When you say, “Our SAM is $900 million because we’re targeting UK-based SMEs with 5-50 employees in the professional services sector, and here’s the data to support that,” an investor thinks: this person knows what they’re doing.
When you say, “Our market is huge — potentially worth trillions,” an investor thinks: this person watched a YouTube video about startups last Tuesday.
You don’t want to be the person who watched a YouTube video about startups last Tuesday.
Common SAM Mistakes Founders Make
- Treating SAM like a slightly smaller TAM. SAM must be filtered through real-world operational constraints. If you’re a UK-only SaaS product, you cannot include the US market in your SAM. That’s TAM territory.
- Ignoring pricing as a filter. If your product costs £2,000 per month and you’re targeting sole traders who make £30,000 a year, your SAM is not as big as you think. Nobody is spending 80% of their revenue on your software. Nobody.
- Not accounting for the competitive landscape. Your SAM is the total available market before competitor share. It is not the market you’ll get — that’s SOM. Confusing the two is a rookie mistake that will get you roasted in a pitch meeting. Not the fun Netflix special kind of roasted. The kind where you want to go home and reassess your life choices.
SOM — Serviceable Obtainable Market
SOM is the realistic slice of your SAM that you can actually capture in the near term, given your current resources, team, go-to-market strategy, and competitive landscape.
This is the number that actually matters for your first 12 to 36 months in business. This is what drives your financial projections, your hiring plan, your marketing budget, and your operational strategy. Get this wrong and your whole model falls apart like a founder’s pitch deck when the projector dies five slides in.
SOM is where you stop dreaming and start planning.
Calculating SOM requires honest answers to some uncomfortable questions:
- How many customers can your team actually onboard and support right now?
- What is your current sales capacity?
- How much runway do you have to execute a go-to-market strategy?
- What is a realistic market share, given who else is competing in your SAM?
- How long does it take to close a customer?
The Toptal Finance team’s peer-reviewed analysis of TAM methodology uses WeWork as a case study to illustrate SOM calculation in practice. In 2016, WeWork leased approximately 64% of newly available coworking space in the USA — a stat that directly informed their SOM estimate. The analysis concluded that SOM should be grounded in competitive benchmarks and demonstrated traction, not aspirational hope. [5]
Here’s another way to think about it. Your SOM is the answer to the question: “What can you actually WIN?”
Not what theoretically exists. Not what you could serve if you had infinite money, infinite staff, and infinite time. What you can WIN. With your current resources. In the real world. Today.
Investors — particularly at the Series A and later stages — will scrutinise your SOM more than almost any other number in your deck. Because your SOM, when connected to your revenue projections, tells them whether your business model makes sense.
And here’s a critical point that even experienced founders miss: your SOM and your revenue projections must be consistent. If you say your SOM is $50 million but you’re projecting $50 million in revenue in Year 2, you’re implicitly claiming 100% market share of your SOM. That’s not ambitious. That’s hallucinatory. Investors will catch this. They always catch this. It’s literally what they do all day while you’re busy trying to build your company.
Warner’s analysis explicitly flags this consistency requirement: founders must ensure their financial projections, go-to-market strategy, and TAM/SAM/SOM all tell the same coherent story. [3] A realistic SOM capture rate for an early-stage startup is typically between 1% and 5% of SAM in Year 1. If you’re projecting 30% market share in 18 months, you’d better have an extraordinary explanation — and it had better not involve the phrase “viral growth.”
Case Study: Uber’s SOM in Early Days
When Uber launched in San Francisco in 2010, their SOM wasn’t the global transportation market. It wasn’t even the entire US taxi market. It was San Francisco. One city. Premium black car service. High-income early adopters who had smartphones and hated waiting for cabs. That was it. A tiny, laser-focused SOM. But it was the right SOM — because it was achievable, defensible, and learnable. And from that tiny SOM, they built the playbook that they then replicated city by city across the world. TAM: the global transportation market (trillions). SAM: the US urban ride-hailing market. SOM (Year 1): San Francisco premium car service. Start small. Win big. Scale relentlessly.
The Trader’s Honest Breakdown: How to Calculate All Three
Alright, enough theory. Let’s talk about how you actually do this. I’m going to walk you through a worked example that you can adapt for your own business. We’re going to use a fictional company: ClearBooks — a cloud-based bookkeeping software for freelancers in the UK.
Step 1: Calculate TAM
Question: What is the total global market for bookkeeping and accounting software?
Source: According to Statista and multiple industry reports, the global accounting software market was valued at approximately $15 billion in 2023, with projections to reach $25 billion by 2028.
ClearBooks TAM: $15–25 billion globally.
Step 2: Calculate SAM
Filters to apply:
- Geography: UK only
- Customer segment: Freelancers and sole traders (not large enterprises, not accountancy firms)
- Pricing: £20/month — accessible to independent workers
Calculation (Bottom-Up):
- UK has approximately 4.2 million self-employed individuals (Office for National Statistics, 2023)
- Approximately 60% actively use some form of bookkeeping tool or are open to digital adoption: ~2.5 million potential users
- At £20/month: 2.5 million × £240/year = £600 million SAM
ClearBooks SAM: ~£600 million annually.
Step 3: Calculate SOM
Filters to apply:
- Year 1 focus: English-speaking freelancers in London and Manchester
- Current team capacity: 2 salespeople, word-of-mouth and content marketing
- Competitor landscape: Already dominated by FreeAgent, QuickBooks, Xero
- Realistic capture rate: 0.5%–1% of SAM in Year 1
Calculation:
- 0.5% of £600 million = £3 million SOM
- 1% of £600 million = £6 million SOM
- Year 1 Revenue Target: £3–6 million (1,250–2,500 customers at £240/year)
ClearBooks SOM: £3–6 million in Year 1.
Is £3 million a small number? To some people, yes. To an investor evaluating a pre-seed or seed-stage SaaS business with a plausible go-to-market strategy and a £600 million SAM? That’s a very reasonable, credible, and defensible first-year target. And that’s exactly what you want to be: credible. Not grandiose. Credible.
How to Present TAM, SAM, SOM in Your Pitch Deck
Right. You’ve done the work. You’ve got your numbers. Now how do you present them without boring the room to death or making yourself look like you’ve spent three hours on Wikipedia the night before?
Here’s the formula that works:
1. Lead with the big number (TAM) for context. Investors need to know the market is big enough to justify building a venture-backed company. If your TAM is $50 million globally, many VCs won’t be interested — the exit potential isn’t there. If your TAM is $5 billion, you’ve got their attention.
2. Funnel down to SAM with specificity. Show your work. Explain the filters you applied. Name the data sources. This demonstrates intellectual rigour and builds trust. An investor who challenges your SAM number and finds you can defend every assumption is an investor who is starting to believe in you.
3. Land on SOM with confidence and humility simultaneously. This sounds like a contradiction but it isn’t. Confidence: “We believe we can capture 1% of our SAM in Year 1.” Humility: “Based on comparable SaaS businesses at this stage and our current go-to-market capacity.” You’re not claiming to conquer the world. You’re claiming to win a well-defined piece of it. That’s attractive.
4. Connect SOM to your financials. Your SOM should directly underpin your revenue projections. If they don’t match, fix them before the meeting. Because if they don’t match in the meeting, you will find out in real time that investors are very, very good at maths.
5. Use a visual. Three concentric circles. A funnel diagram. Something that makes the hierarchy of TAM → SAM → SOM immediately obvious without reading a single word. Investors see hundreds of decks. Make yours scannable.
The F22 Labs market sizing guide notes that a well-researched market size makes your pitch more convincing and increases the likelihood of securing funding — precisely because it demonstrates you’ve done the intellectual work before asking someone to write you a cheque. [6]
Top-Down vs Bottom-Up: Which Method Should You Use?
This is a question I get all the time. The honest answer is: both. Always both.
Top-Down gives you credibility by anchoring your numbers to recognised industry sources. When you say “According to Gartner…” or “Based on McKinsey’s latest industry analysis…”, investors recognise those names and their scepticism drops approximately three notches. Top-down is fast and gives the macro context that helps investors situate your opportunity.
Bottom-Up gives you precision and demonstrates customer-level insight. When you build your market size from the number of potential customers multiplied by your ARPU, you’re showing that you understand exactly who you’re selling to and what they’ll pay. This is far more impressive to an experienced investor than any Gartner figure.
Use top-down to frame the opportunity. Use bottom-up to validate your specific numbers. Show both in your analysis (even if you only show one on the slide). And make sure they broadly agree with each other — within a factor of 2 is generally acceptable for early-stage analysis.
The Business Initiative’s comprehensive guide to Total Addressable Market analysis echoes this: founders should segment their TAM into SAM and SOM using multiple validation methods and credible data sources, and should regularly update their analysis as markets evolve — because markets don’t sit still and neither should your model. [7]
The Academic Evidence: Why Market Sizing Predicts Startup Success
Let’s get serious for a moment. Because this isn’t just best practice — there’s actual research behind why this matters.
Lerner and Nanda’s 2020 study on venture capital and economic growth, published in the Journal of Economic Perspectives, found that VC-backed companies disproportionately succeed in large, growing markets — precisely because large markets provide room for multiple business models, pricing experiments, and pivots without running out of room. [8] Founders who accurately identify large, underserved SAMs are positioning themselves in exactly the kind of market environment where venture capital can have maximum impact.
The seminal NBER working paper by Da Rin, Hellmann, and Puri — “A Survey of Venture Capital Research” — synthesised decades of academic literature on how VCs evaluate investment opportunities. Their findings are unambiguous: market size is a primary decision criterion at every stage of the investment process, from initial screening to due diligence to term sheet. [1] If you can’t articulate your TAM, SAM, and SOM in a way that stands up to scrutiny, you are starting the investment conversation at a significant disadvantage.
Thurik, Audretsch, and colleagues’ 2023 paper in Small Business Economics — “The Impact of Entrepreneurship Research on Other Academic Fields” — demonstrated that the rigour applied at the startup planning stage, including market analysis, has measurable downstream effects on company performance, investor relations, and economic contribution. [9] In other words: do the homework now, reap the rewards later. Skip the homework, explain yourself to your investors in an uncomfortable quarterly review meeting where everyone is looking at their phones.
The StartUpNV framework for TAM/SAM/SOM analysis further reinforces that secondary research — including government publications, industry reports, and academic studies — should form the bedrock of any credible market sizing exercise. [10] This means your numbers should be traceable. If an investor asks, “Where did you get this figure from?”, you should be able to answer with a source, not a shrug.
Common Mistakes (And How Not to Make Them)
I’ve seen hundreds of decks in my career as a trader and early-stage investor. Here are the mistakes I see most often, and how to fix them before they cost you a deal.
Mistake #1: The “Trillion Dollar Market” Problem
Pitching a TAM that is so enormous it’s meaningless. The global food market. The global healthcare market. The global internet market. These numbers do not impress sophisticated investors. They signal that you haven’t done the real work of understanding your specific opportunity. Fix it by being more precise in your industry definition.
Mistake #2: Confusing TAM and SAM
Presenting a SAM that is basically your TAM with a small percentage knocked off. “The global market is $10 billion. Our market is… $9.5 billion.” Sir. Ma’am. That is not a SAM. That is a TAM with a slight discount and a new label. Fix it by applying genuine operational and demographic filters.
Mistake #3: Making Up Your SOM
Projecting a SOM that has no relationship to your current resources, team size, or go-to-market strategy. “We’ll capture 20% of the UK market in Year 1 through viral growth and strategic partnerships.” You’ve been operating for six months. You have four employees. Your “strategic partnerships” are two conversations that have not resulted in a signed contract. Fix it by grounding your SOM in comparable benchmarks from similar-stage companies.
Mistake #4: Static Analysis
Presenting market sizing as if the market is frozen in time. Markets grow. Markets shrink. Markets get disrupted. A market that’s $5 billion today might be $15 billion in five years — and that’s a very different investment opportunity. Always include a CAGR (Compound Annual Growth Rate) alongside your market size. It shows the market is moving in the right direction and adds dynamism to your narrative.
Mistake #5: Not Connecting Market Size to Strategy
Presenting your TAM/SAM/SOM as an isolated slide with no connection to your go-to-market plan. Market sizing is not a box to check. It is the foundation of your strategic logic. Make explicit the link between your SOM and how you’re going to capture it. Channel partnerships? Content marketing? Direct sales? Enterprise deals? Whatever your strategy, the market sizing should make it obvious why that strategy makes sense for this particular market.
A Note on Market Sizing for Pre-Revenue Startups
I hear you. “But I don’t have any revenue yet. How do I calculate a credible SOM when I’ve never sold anything?”
Fair question. Here’s the trader’s honest answer.
For pre-revenue startups, your SOM should be based on:
- Customer discovery interviews. Talk to at least 50 potential customers. What would they pay? How often? What’s the switching cost from their current solution? This data grounds your assumptions in real human behaviour rather than hopeful projection.
- Comparable company benchmarks. Find a company that launched in a similar market with similar resources and look at their early traction. What was their Year 1 revenue? How many customers did they acquire? Use this as a reference point for your own SOM.
- Pilot or MVP results. If you’ve run any kind of pilot — even a manual, scrappy, completely unscalable version of your product — use those results to extrapolate. Ten beta customers paying £100/month tells you something real about your SAM and SOM that no amount of desk research can replicate.
- Expert interviews. Talk to people who know your market deeply. Industry consultants, former executives of competitor companies, advisors who’ve built businesses in your space. Their qualitative insight, when combined with quantitative data, makes for an extraordinarily compelling market narrative.
The Antler Framework: What Sophisticated Investors Actually Look For
The Antler venture capital firm — one of the world’s leading early-stage investors — has been explicit about what they look for in market sizing. In their publicly available guidance on TAM/SAM/SOM, they note that financial reports from publicly traded companies are among the most valuable (and underused) resources for calculating market size — precisely because they are audited, structured, and credible. [11]
If your market has publicly traded companies operating in it (and most do), those companies file detailed financial disclosures that can anchor your market sizing in verified data. A large competitor’s annual report telling you their total addressable market is $20 billion is worth ten industry analyst reports — because they have auditors, they have fiduciary duties, and they do not get to make up numbers.
Use these sources. They are freely available. And they will make your market sizing the most credible slide in your deck.
TAM, SAM, SOM in Different Funding Stages
One more thing that founders often overlook: the same market can be presented differently depending on which funding stage you’re at.
Pre-Seed / Seed: At this stage, investors care most about SAM and SOM. They want to know you understand your immediate opportunity and have a credible path to initial traction. TAM provides context, but it’s the SOM that drives conviction.
Series A: Investors are now looking at your traction against your original SOM projections. Did you hit your SOM targets? Are you ready to expand your SAM? At this stage, your market sizing update should reflect what you’ve learned from actually being in the market.
Series B and Beyond: Now TAM becomes the dominant conversation. You’ve proved the model in your SAM. Now investors want to know: how big can this really get? Can you expand internationally? Can you move into adjacent markets? The TAM conversation at Series B is about ceiling, not starting point.
The research by Hua, Wang, and Wang (2016), published in the China Economic Journal, found that venture-backed SMEs that demonstrated clear market expansion roadmaps — essentially showing how they’d move from SOM to SAM to TAM over time — consistently outperformed peers in terms of growth rate and follow-on investment success. [12] Your market sizing isn’t just a static snapshot. It’s a roadmap. Present it as one.
Final Thoughts from the Trading Floor
Look, I’ve been in finance a long time. I’ve seen markets boom and markets crash. I’ve watched startups go from a bedroom and a dream to a billion-dollar exit, and I’ve watched others — with arguably better products — go bankrupt because they never understood their market well enough to build a defensible position in it.
TAM, SAM, and SOM are not bureaucratic boxes. They are the intellectual foundation of your business strategy. They force you to think clearly about who you serve, how many of them exist, what they’re worth to you, and how you’re going to reach them. They force you to be honest with yourself — and honesty with yourself is the rarest and most valuable entrepreneurial trait there is.
So here’s my final advice, from a trader who has seen both sides of the table more times than he can count.
Do the work. Calculate your TAM from credible sources. Apply genuine filters to get your SAM. Ground your SOM in reality and humility. Connect your market sizing to your strategy. Update your analysis regularly as you learn more.
And when an investor sits across from you and asks, “What’s your TAM?” — don’t clear your throat. Don’t glance at your co-founder. Don’t start talking about the global food market.
Just answer the question. Confidently. Precisely. With data.
That’s how you go from a pitch meeting to a term sheet. That’s how you go from a dream to a company.
Now go size that market.
References
- Da Rin, M., Hellmann, T., & Puri, M. (2013). A Survey of Venture Capital Research. In G. Constantinides, M. Harris, & R. Stulz (Eds.), Handbook of the Economics of Finance (Vol. 2A, pp. 573–648). Elsevier. https://www.sciencedirect.com/science/article/abs/pii/B9780444535948000082 | NBER Working Paper: https://www.nber.org/system/files/working_papers/w17523/w17523.pdf
- Gu, W., Qian, X., & Lu, J. (2018). Venture capital and entrepreneurship: a conceptual model and research suggestions. International Entrepreneurship and Management Journal, 14(1), 35–50. https://link.springer.com/article/10.1007/s11365-017-0463-6
- Warner, J. (2025). Effective Market Sizing (TAM, SAM, SOM, PAM) for Startups and VCs. Medium. https://optimaljon.medium.com/effective-market-sizing-tam-sam-som-pam-for-startups-and-vcs-e7b0847af8c0
- Patel, B. (2026). Market Research for Startups: The Complete Guide to Customer Discovery, TAM-SAM-SOM Sizing, and Competitive Analysis. Parul University — PIERC Programme. https://www.paruluniversity.ac.in/blog/market-research-for-startups-the-complete-guide-to-customer-discovery-tam-sam-som-sizing-and-competitive-analysis-that-pierc-teaches-student-founders/
- Toptal Finance. (2024). TAM Methodology: An Explanation and Example of Total Addressable Market Analysis (Peer-reviewed by Toptal Finance Experts). Toptal. https://www.toptal.com/finance/market-sizing/total-addressable-market-example
- F22 Labs. (2026). Market Sizing for Startups: How to Calculate TAM, SAM & SOM. F22 Labs Blog. https://www.f22labs.com/blogs/market-sizing-guide/
- Business Initiative. (2025). Total Addressable Market (TAM): The Complete Guide to Market Sizing for Business Success in 2025. https://www.businessinitiative.org/business-tips/total-addressable-market/
- Boateng, A., et al. (2025). Venture capital’s role in driving nascent enterprises to industry market leaders. Cogent Business & Management, 12(1). (Citing Lerner & Nanda, 2020, Journal of Economic Perspectives.) https://www.tandfonline.com/doi/full/10.1080/23311975.2025.2484458
- Thurik, A. R., Audretsch, D. B., Block, J. H., Burke, A., Carree, M. A., Dejardin, M., … Wiklund, J. (2023). The impact of entrepreneurship research on other academic fields. Small Business Economics, 61, 1–18. DOI: 10.1007/s11187-023-00781-3. https://www.ncbi.nlm.nih.gov/pmc/articles/PMC10201490/
- StartUpNV. (n.d.). TAM SAM SOM Examples. StartUpNV Resource Library. https://startupnv.org/tam-sam-som-example/
- Antler VC. (n.d.). TAM, SAM & SOM: How To Calculate The Size Of Your Market. Antler Blog. https://www.antler.co/blog/tam-sam-som
- Hua, X., Wang, Y., & Wang, M. (2016). The innovation and performance impacts of venture capital investment on China’s small-and medium-sized enterprises. China Economic Journal, 9(2), 167–185. DOI: 10.1080/17538963.2016.1165541. https://www.tandfonline.com/doi/10.1080/17538963.2016.1165541
Disclaimer: This article is for informational and educational purposes only and does not constitute financial or trading advice.
Leave a Reply
You must be logged in to post a comment.