

Tesla, Inc. (NASDAQ: TSLA) | Spot: ~$354 | September 7, 2026
TSLA is consolidating between $351 and $363 after a sharp rejection from the $384 high, with higher timeframes still neutral-to-bearish and lower timeframes basing after an RSI reset. The highest-probability trades are breakout setups off this range: long on a reclaim of $363 targeting $370-$384, or short on a rejection back toward $340-$351.
1. Multi-Timeframe Structural Analysis
🔵 Weekly (Macro Trend)
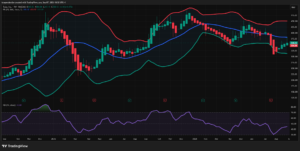
- Market Structure: Choppy, range-bound “trending consolidation” over the last 24 months. Price made a major swing high near ~$480 (Dec 2024), collapsed to ~$215 (Apr 2025), rallied back to retest ~$475–$480 (Dec 2025) — a double-top structure — then broke down again through 2026 into a lower-high, lower-low sequence (peak ~$425 in July 2026 vs. the Dec 2025 peak). Net: the weekly trend has been bearish-to-neutral since December 2025.
- Key Levels: Resistance at $400 (psychological/basis confluence) and $425–$450 (July swing high / upper band). Support at $300–312 (recent capitulation low and current lower band) and $350 (round-number pivot).
- Bollinger Bands: Bands are expanding following the sharp August sell-off (a volatility shock), and price is now sitting below the basis (blue, $381.62), in the lower half of the envelope — consistent with a corrective/recovery bounce inside a still-damaged macro structure, not a fresh uptrend.
🟣 Daily (Swing Trend)
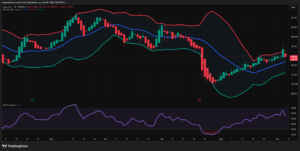
- Market Structure: A sharp downtrend from mid-May ($440) into late-July ($290, roughly -34%) was followed by a strong V-shaped recovery back to the low-$370s by early September — effectively Higher Lows forming since the July bottom. However, the most recent daily candle is a large bearish rejection candle (open $364.83, high $364.83, low $351.32, close $358.04, -4.0%), which stalls the recovery right at the prior structural resistance shelf (~$365–370).
- Key Levels: Resistance at $365–370 (multiple prior swing lows from June, now acting as overhead supply) and $400. Support at the daily basis (~$347.5) and the psychological $325–330 zone (former neckline).
- Bollinger Bands: Price tagged the upper band ($370.10) and was sharply rejected, now pulling back toward the basis — a classic “band-walk exhaustion” signal after a strong impulsive leg.
🟠 4-Hour (Intermediate Trend)
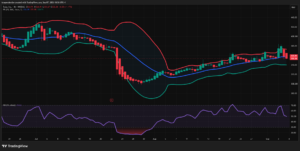
- Market Structure: Clean, orderly uptrend channel from late-July lows (~$290) into early September (~$384), followed by a violent impulsive reversal candle that broke the channel, dropping price ~8% in a single session before basing.
- Key Levels: Resistance $370–384 (channel top / recent high). Support at the 4H basis (~$356) — currently being tested from below — and $340 (lower band / prior breakout base).
- Bollinger Bands: Bands expanded sharply on the breakdown candle and are now contracting/squeezing as price consolidates just under the basis — often a precursor to the next directional expansion.
🔴 1-Hour (Execution Trend)
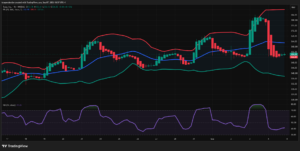
- Market Structure: A steady grind higher from $338 (Aug 18) to $384 (Sep 3), then a two-candle waterfall decline back to $353–355, followed by tight sideways consolidation (small-bodied dojis/spinning tops) for the last 3 sessions — a potential basing/accumulation pattern after the shock.
- Key Levels: Immediate resistance $358–363 (basis + supply from the failed breakdown candles’ bodies). Support $351–353 (session lows) and $337–340 (lower band).
- Bollinger Bands: Price is compressing below the basis ($362.89), inside a narrowing range — a short-term squeeze setting up for a breakout in either direction.
2. Price Action & Candlestick Patterns
- Daily — Shooting-star-type rejection at $370.10 (upper BB): Long upper wick relative to body, closing near the low of the day. This is a textbook exhaustion signal at the outer band, occurring right where the June swing-low resistance shelf sits — high-consequence confluence.
- 4H — Large bearish engulfing/marubozu breakdown candle: Engulfed several prior green candles and closed the 4H trend channel — a continuation-of-distribution signal after the euphoric run to $384.
- 1H — Post-crash doji cluster (Sep 4–7): Multiple small-bodied indecision candles sitting just above the $351–353 low. This is the most actionable pattern on the sheet: it suggests selling pressure has stalled, and the market is deciding direction. A break of the cluster’s high (~$358–360) or low (~$351) will likely define the next intraday leg.
- Chart Pattern (Daily/Weekly): The Dec 2024 → Dec 2025 sequence resembles a broad double top near $480, and the 2026 price action (rally-fail-rally) resembles a descending peaks pattern — structurally bearish until $400+ is reclaimed and held.
3. RSI Momentum & Divergence
| Timeframe | RSI | Zone | Notes |
|---|---|---|---|
| Weekly | 44.80 | Below midline | Recovering from an oversold reading during the August crash; still sub-50, no confirmed trend resumption |
| Daily | 54.33 | Neutral, pulling back | Peaked near 63–65 into the price high, now rolling over with price — not yet a bearish divergence, just normal momentum unwind |
| 4H | 49.62 | Neutral | Dropped from ~68 (near overbought) sharply alongside the breakdown candle — momentum fully reset |
| 1H | 41.35 | Below midline, recovering | Spiked into overbought (~78) right before the crash, then plunged to ~35 (oversold), now basing — mirrors the price consolidation |
- Divergence Check: No clean regular bearish divergence is visible (price made a new high into Sep 3 and RSI also made a corresponding high on the 4H/1H before the drop) — this was momentum exhaustion, not divergence-led. However, watch the daily RSI: if price makes a lower low below $351 while daily RSI holds above the low from late July, that would constitute a hidden bullish divergence favoring trend continuation of the July–Sep recovery.
- Midline Confluence: Both the daily and weekly RSI are hovering close to the 50 line — this is the key tell. A daily close of RSI back above 55–60 would support bulls; a rejection back under 45 confirms sellers are back in control on the swing timeframe.
4. Technical Confluence Synthesis
High-probability zone — Resistance ($363–370): 1H basis ($362.89) + 4H basis ($356–363 zone) + Daily upper band ($370.10) + Daily prior resistance shelf all cluster together. This is the line in the sand for any bounce attempt.
High-probability zone — Support ($337–351): 1H/4H lower bands ($337–340) + the Sep 4 crash-candle low ($351.32) + Daily basis ($347.52) form a layered support shelf. A break and daily close below $351 opens a retest of $325–340.
Current price (~$354) sits in the “no-man’s-land” between these two confluence zones — inside the 1H/4H squeeze — meaning the highest-quality setups right now are breakout/breakdown trades off the $351–363 range, not mean-reversion trades in the middle of it.
5. Sentiment Score & Catalysts
Sentiment Gauge: 🔴🟡 Neutral-to-Bearish (short-term), Neutral (medium-term)
Key Catalysts
- Tesla’s stock dropped nearly 6% on Sept. 4, 2026, following its private Austin Cybercab event, which left key autonomy questions unanswered.
- The National Highway Traffic Safety Administration opened an “audit query” into whether the Cybercab complies with U.S. safety standards, adding regulatory overhang.
- The event notably excluded CEO Elon Musk, was limited to a small invite-only group, and was not livestreamed as Tesla events typically are, which itself was read as a bearish signal by investors.
- RBC Capital Markets noted the event left “key outstanding questions around pricing, production cadence, and regulatory approvals” unanswered.
- Sell-side reaction is split: Tesla received a bullish note from Goldman Sachs after the Cybercab event, while GLJ Research’s Gordon Johnson reiterated a Sell rating with a deeply bearish price target — reflecting a wide dispersion of institutional views.
- Fundamentally, Tesla’s Q2 2026 revenue beat estimates at $28.24B, but EPS missed by 32.65% and automotive margins fell to 16.3% from 19.2%, underscoring continued margin pressure even as delivery volumes recover.
- Morningstar’s Seth Goldstein maintains Tesla’s valuation is under review following the Cybercab launch disappointment.
🟢 Bullish Drivers
- Q2 delivery growth and energy storage deployment strength beating estimates
- Some sell-side upgrades (Goldman Sachs) framing the Cybercab launch as a long-term positive despite the near-term “sell the news” reaction
- Strong technical recovery off the July capitulation low (+20%+ off the bottom before the current pullback)
🔴 Bearish Drivers
- Federal regulatory probe (NHTSA) into Cybercab safety certification
- Disappointing, opaque product event with unanswered questions on pricing/scale
- Compressed automotive margins and stretched valuation (very high P/E) leaving little room for execution missteps
- Bearish analyst notes (GLJ Research) citing overvaluation risk
- Broader concerns Tesla could sink further in late 2026 given intense EV price competition from rivals like BYD
Further reading:
- Stock Market Today, Sept. 4: Tesla Falls After Cybercab Launch Disappoints Investors — Yahoo Finance / The Motley Fool
- Tesla’s Stock Drops 6% as Cybercab Update “Underwhelms” Wall Street — CNBC
- Why Did Tesla Stock Fall Today? — The Motley Fool
- Tesla Inc TSLA Stock Price Quote — Morningstar
- Tesla Stock Price Today — Investing.com
- Tesla Stock Drops on Cybercab Flop: Closing Bell Sept. 4, 2026 — TradingStrategyGuides
- Tesla (TSLA) Stock Could Sink in the Last Half of 2026 — Forbes
6. Final Actionable Trading Ideas
💡 Idea 1 — Swing Trade: Long on Reclaim of $363 (Higher-Timeframe Bounce Continuation)
- Direction: Long
- Strategic Rationale: The daily/weekly RSI remain above the deeply oversold levels seen in July, and price is still respecting the higher-low structure off the $290 capitulation low. A reclaim of the 4H/1H basis and daily resistance shelf would confirm the corrective bounce is intact and targeting a retest of the $370–384 supply zone.
- Execution Trigger: Wait for a 1H candle close above $363 (1H basis) and a 4H candle close above its basis (~$356–358) to confirm buyers have retaken control — avoid entering inside the current consolidation.
- Risk Management:
- Stop Loss: Below $351 (Sep 4 crash-candle low / key structural support) — a break here invalidates the base.
- Take Profit T1: $370 (Daily upper BB / prior resistance shelf)
- Take Profit T2: $384 (Sep 3 swing high / 1H upper band)
💡 Idea 2 — Day Trade/Scalp: Short on Rejection at $358–363 (Fade the Failed Bounce)
- Direction: Short
- Strategic Rationale: The daily rejection candle at the upper band, combined with the 4H momentum reset from overbought, suggests the path of least resistance short-term is a retest of the lower support shelf before any sustained recovery. The 1H consolidation range offers a defined risk/reward fade if price fails to reclaim the basis.
- Execution Trigger: Enter on a 1H bearish rejection candle (upper wick / engulfing) at $358–363, ideally with RSI failing to clear 50 on the 1H.
- Risk Management:
- Stop Loss: Above $365 (daily resistance shelf / invalidates the fade thesis)
- Take Profit T1: $351 (recent range low)
- Take Profit T2: $340 (4H/1H lower band and daily basis confluence)
⚠️ Disclaimer: This is a technical/educational analysis, not financial or investment advice. Given TSLA’s elevated volatility and event-driven risk (regulatory headlines, Musk-related news flow), position sizing and stop discipline are critical — confirm triggers on live price action before execution. Not a licensed financial advisor.
Leave a Reply
You must be logged in to post a comment.