

Date: September 5, 2026, 10:53 UTC+1 Spot reference: ~$79,650–79,700 Timeframes reviewed: Weekly · Daily · 4-Hour · 1-Hour Indicators: Bollinger Bands (20, SMA, 2σ) · RSI (14, close)
Bitcoin is consolidating near $79,650 after its sharp August rally stalled at a $82,000 double-top resistance, with daily RSI overbought (72) even as the weekly and daily trend structure remains bullish. The highest-probability setup favors buying dips into the $76,000–$77,600 support zone, while a confirmed daily close above $82,300 would open the path toward $85,000–$86,000.
1. Multi-Timeframe Structural Analysis
Weekly
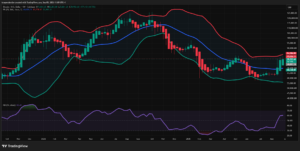
- Structure: A broad bullish cycle from the ~$65K low in late 2024 into a swing high near $125K in August 2025, followed by a deep corrective phase into a double bottom around $55–65K (February 2026, retested June–August 2026). The most recent 2–3 weeks show a sharp impulsive reclaim off that second bottom, printing a large green weekly candle back to a $78,956 close.
- Key levels: Major support at $65–68K (double-bottom shelf); resistance at $82–86K (upper Bollinger Band plus the top of the recent breakout range), with heavier supply near $95–100K.
- Bollinger Bands: Contracted sharply at the double bottom (a classic pre-breakout squeeze) and are now re-expanding as price pushes off the 20-SMA ($69,876) toward the upper band ($83,759).
- RSI: 60.29, rising out of the 30–40 oversold shelf toward the midline/60s — structurally bullish but not yet overbought, meaning the weekly trend has room left before becoming stretched.
Daily
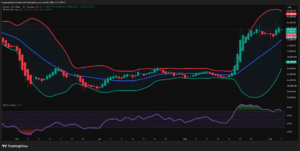
- Structure: A sideways range between ~$60K–$66K from mid-June through mid-August gave way to an explosive breakout in the back half of August, rallying into resistance near $85K before the current pullback/consolidation.
- Key levels: Immediate support at $76,000 (mid-band / breakout retest zone); resistance at $84,986 (recent swing high) and the upper band at $86,012.
- Bollinger Bands: Rode the upper band through the entire August rally (a strong trend signature), now pulling back toward the 20-SMA ($76,028) — a normal band-walk-to-mean-reversion transition.
- RSI: 72.02 — still overbought despite the day’s -0.76% pullback, meaning momentum hasn’t fully unwound yet.
4-Hour
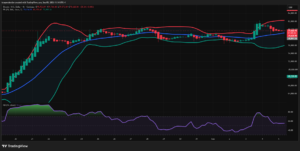
- Structure: A clean trend leg from ~$68K (Aug 20) to ~$82K (Aug 24–25), followed by range-bound consolidation ($74K–$82K) through early September, punctuated by a second spike back to ~$82K (Sep 3–4) — effectively a double top at the same resistance shelf.
- Bollinger Bands: Squeezed noticeably Aug 26–Sep 2 (volatility contraction) ahead of the Sep 3–4 expansion move. Price now sits back near the mid-band (~$79,135).
- RSI: Oscillated from overbought (~80) at both peaks down to the low-40s during range dips — a rhythmic overbought/oversold cycle typical of a range rather than a decisive breakout signal.
1-Hour
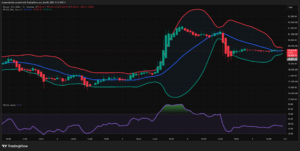
- Structure: A sharp rally on Sep 3 (12:00–21:00) from ~$77,600 to ~$81,600, a rounded top Sep 3–4, then an aggressive selloff into Sep 4 (15:00) back to ~$78,900, followed by tight sideways consolidation into Sep 5 near $79,650.
- Bollinger Bands: Currently squeezing — upper ($79,913), mid ($79,588), and lower ($79,264) bands have converged tightly, signaling an imminent volatility expansion.
- RSI: 46.52 — sitting almost exactly on the 50 midline after recovering from a sub-30 oversold flush on Sep 4, a classic “coiled” reading ahead of a directional resolution.
2. Price Action & Candlestick Patterns
- 1H rounding top (Sep 3, 21:00 – Sep 4, 03:00): Small-bodied candles/dojis near $81,200–81,600 right at the daily/weekly resistance shelf — a distribution top that preceded the reversal.
- 1H capitulation candles (Sep 4, 09:00–15:00): Two large red candles piercing the mid-band and probing the lower band, consistent with the leveraged liquidation cascade reported that day (see §5).
- 1H tight-range consolidation (last 12–15 hours): An inside-bar cluster just above the 20-SMA — a possible continuation flag, though direction is unconfirmed until the Bollinger squeeze resolves.
- 4H double top (~$82K, Aug 24–25 & Sep 3–4): Two comparable highs at the same level — a classic reversal/range-topping pattern, reinforced by daily overbought RSI at the second peak.
- Daily rounded base (Jun–Aug): A basing structure at the $57–66K range floor resembling accumulation, resolved by a large-bodied breakout candle in mid-August.
- Weekly: The most recent candle is a strong bullish bar off the $68K double bottom — currently the dominant weekly pattern.
3. RSI Momentum & Divergence Analysis
- Overbought/oversold: Daily RSI (72) and both 4H/1H peaks (~80) flagged overbought at/near the $81–82K highs. The 1H flush pushed RSI to ~30 before recovering.
- Divergence check:
- 1H (mild bearish signal): Price nudged a marginally higher high into the Sep 3–4 rounded top while RSI failed to sustain its prior extreme, rolling over before price fully topped.
- 4H (developing): The Sep 3–4 retest of ~$82K carried momentum that did not clearly exceed the initial Aug 24–25 overbought reading — a double top with matching/weaker momentum, worth watching on a third test.
- Daily/Weekly (no divergence yet): Both are still making higher highs with RSI also rising, so the larger-degree trend remains intact — this reads as overbought-in-an-uptrend rather than a confirmed reversal.
- Midline confluence: 1H RSI is parked almost exactly at 50 — a genuine decision point on the lowest timeframe — while 4H (~55) and Daily (72) both still lean bullish by comparison.
4. Technical Confluence Synthesis
- Bullish confluence: Weekly trend resumption + daily RSI still bullish-but-cooling + 1H squeeze sitting on the 20-SMA and RSI midline favor a dip-buy continuation if price holds above the $76,000–$78,900 shelf.
- Bearish/caution confluence: Daily RSI overbought (72) + a 4H/1H double top at $82K aligning with the weekly upper band ($83,759) and the recent swing-high resistance ($84,986–86,012) form a well-defined ceiling that has rejected price twice. Rallies into $81–82K carry higher risk until that zone clears with conviction.
- Highest-probability zone: A 1H/4H pullback into $76,000–$77,600 (prior breakout shelf + 4H mid-band), paired with daily RSI cooling from overbought toward 50–60, offers the cleanest confluence for a continuation long. Conversely, a clean daily close above $82,300 would flip near-term bias decisively bullish toward the $85–86K daily upper band.
5. Sentiment Score & Catalysts
Sentiment Gauge: 🟡 Neutral-to-Cautiously Bullish — bullish macro trend, but momentum is cooling and headline risk is elevated.
Key catalysts from recent coverage:
- Bitcoin logged its strongest monthly performance in nearly two years heading into September, with August’s rally described as roughly a 24% short-squeeze move off the summer lows (Coincall Market Recap, Sep 2).
- Fed Chair Kevin Warsh’s Jackson Hole remarks stressed continued progress on inflation, lifting expectations for another rate hike and briefly pressuring BTC toward $78.7K (Coincall Market Recap, Sep 2).
- A reignition of the Iran war — including fresh U.S. airstrikes and Iranian retaliation against U.S. bases — drove a sharp risk-off move early in the week, before sentiment stabilized on hopes the escalation would be short-lived (Yahoo Finance, Sep 2; Yahoo Finance, Sep 3).
- A leveraged liquidation cascade wiped out roughly $369M in positions (about $301M long) as BTC dipped toward $77,000, followed by a rapid rebound; open interest rose about 6% to $57.68B over three days, underscoring elevated leverage and two-way volatility (CoinStats, Sep 4).
- Bitcoin ETF flows have turned choppy — alternating between strong inflows and withdrawals after an earlier multi-session inflow streak — while corporate accumulation continued, with Strategy (MicroStrategy) reportedly resuming a roughly $370M buying spree (Cryptonomist, Sep 3; Coincall Market Recap, Sep 2).
🟢 Bullish drivers:
- Weekly/monthly structure remains constructive (higher low off the double bottom)
- Renewed institutional/corporate accumulation
- ETF inflow streaks still recurring, even if inconsistent
- Daily price holding above key moving averages despite the pullback
🔴 Bearish drivers:
- Hawkish Fed rhetoric raising rate-hike odds
- Escalating Iran-related geopolitical risk driving volatility spikes
- Elevated leverage in the system, evidenced by large two-way liquidation events
- Daily RSI overbought (72) alongside a 4H/1H double top at $82K signaling short-term exhaustion
6. Final Actionable Trading Ideas
Educational technical scenarios only — not personalized financial or investment advice. Position sizing and risk tolerance are yours to determine.
Idea 1 — Swing Long on Pullback (Daily/4H bias)
- Direction: Long
- Rationale: The weekly/daily uptrend is intact and RSI has not shown a structural bearish divergence on the higher timeframes; the $76,000–$77,600 zone lines up with the prior breakout shelf and the 4H mid-band, allowing daily RSI to cool from overbought without breaking trend structure.
- Execution trigger: A 4H bullish reversal candle (hammer/engulfing) inside $75,800–$77,600 with RSI basing above 40, or a 1H close back above the current squeeze range ($79,900) confirming continuation without the deeper pullback.
- Risk management:
- Stop-loss: Below $74,900 (below the 4H range low and daily lower-band cushion)
- Take Profit T1: $82,000–$82,300 (double-top resistance)
- Take Profit T2: $85,000–$86,000 (daily upper band / recent swing-high resistance)
Idea 2 — Intraday Breakout/Fade at the 1H Squeeze
- Direction: Conditional — long on an upside break, short on a downside break
- Rationale: The 1H bands have compressed tightly with RSI parked at the 50 midline — a textbook pre-expansion setup. Given the mixed higher-timeframe backdrop (bullish weekly/daily trend vs. overbought daily RSI and a 4H double top overhead), the resolution direction should be traded rather than anticipated.
- Execution trigger:
- Long: 1H candle closes above $79,912 (upper band) with RSI pushing through 60.
- Short: 1H candle closes below $79,264 (lower band) with RSI breaking below 40.
- Risk management:
- Stop-loss (Long): Below $79,263 | Stop-loss (Short): Above $79,913 (opposite band in each case)
- Take Profit T1 (Long): $81,200–$81,600 | T1 (Short): $78,900
- Take Profit T2 (Long): $82,000–$82,300 | T2 (Short): $77,600
7. References
- Yahoo Finance — Bitcoin and Ethereum Prices Today, Sep 1, 2026
- Yahoo Finance — Bitcoin and Ethereum Prices Today, Sep 2, 2026 (Iran war reignites)
- Yahoo Finance — Bitcoin and Ethereum Prices Today, Sep 3, 2026
- Fortune — Current Price of Bitcoin, Sep 2, 2026
- Fortune — Current Price of Bitcoin, Sep 3, 2026
- Fortune — Current Price of Bitcoin, Sep 4, 2026
- Cryptonomist — Bitcoin Price Today Analysis: September 2026 Bullish Momentum
- Coincall — Market Recap, Sep 2, 2026 (ETF Flows Reverse, Fed Hike Bets Rise)
- CoinStats — Bitcoin News Today, Sep 4, 2026
- CoinStats — Crypto News Update, Sep 3, 2026
Charts sourced from TradingView (Coinbase BTC/USD feed), captured Sep 5, 2026.
Disclaimer: This document is a technical analysis exercise based on chart patterns and publicly reported news. It does not constitute financial advice. Cryptocurrency markets are highly volatile — always conduct independent research and manage risk according to your own circumstances.
Leave a Reply
You must be logged in to post a comment.