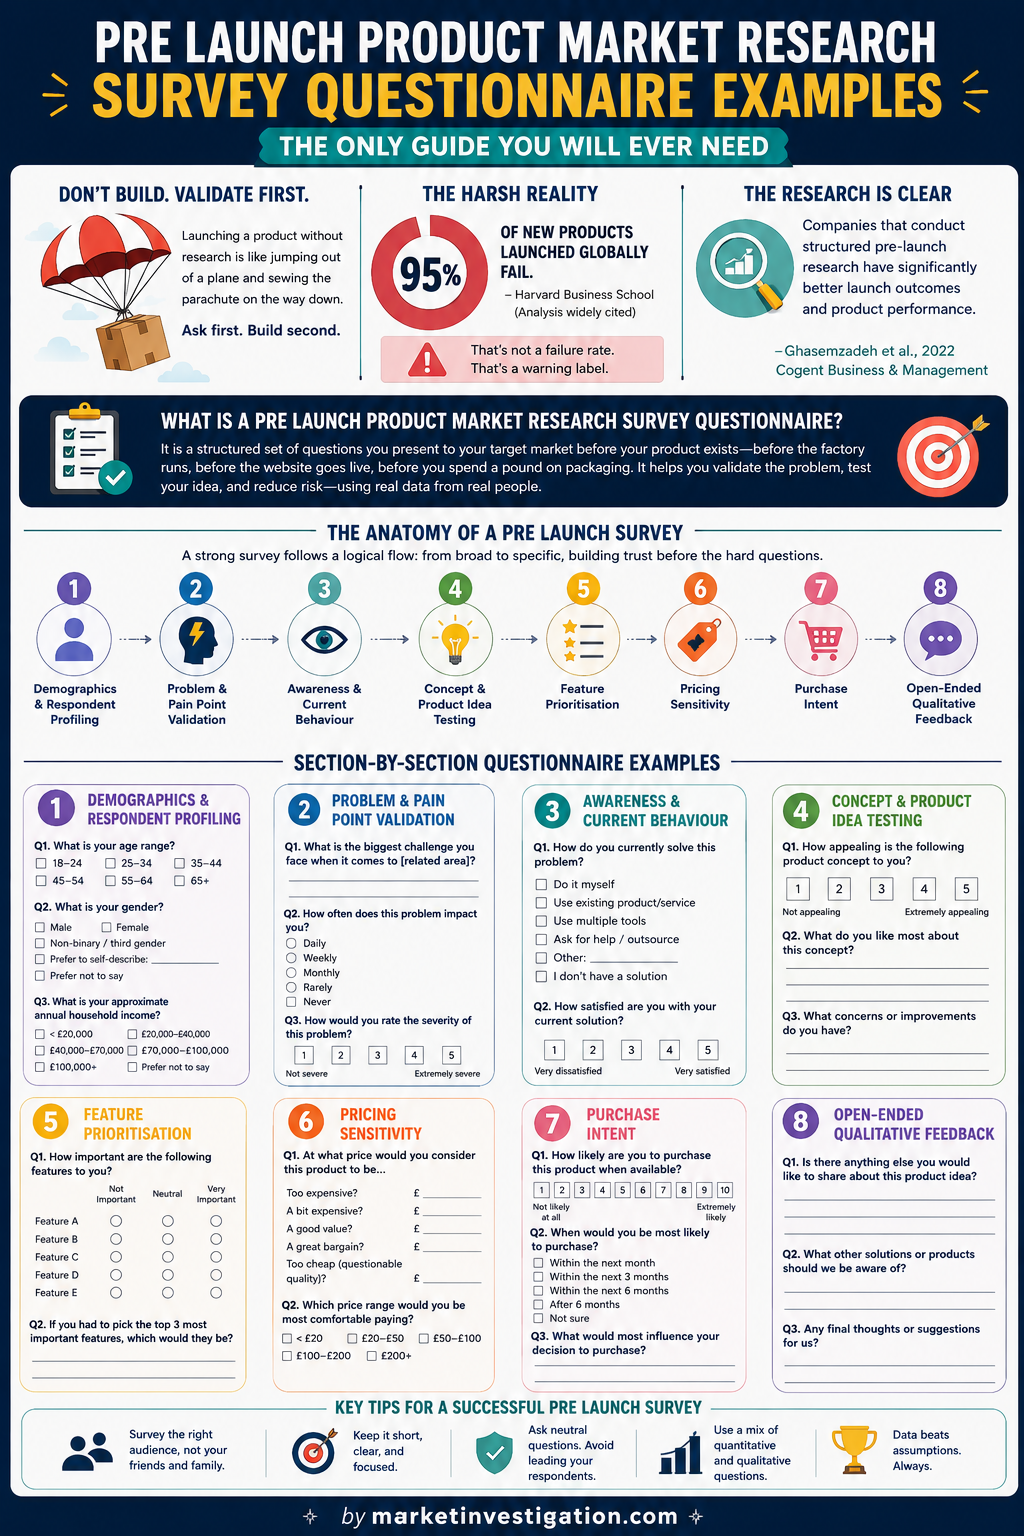
A pre launch product market research survey questionnaire is a structured set of questions used to validate demand, pricing, and features before a product goes to market, dramatically reducing the risk of launch failure.
If you are about to launch a product without running a pre launch product market research survey questionnaire, you are essentially jumping out of a plane and sewing the parachute on the way down — and I say that as a trader who has watched too many grown adults hit the ground at full speed and act surprised.
The Market Has No Sympathy for Your Enthusiasm
Let me introduce myself. I am a trader. I live and die by data. I do not buy a position based on vibes. I do not short a stock because it “feels expensive.” I look at the numbers and the structure, and only then do I make an informed decision. Nobody pays me for confidence. They pay me for being right more often than I am wrong.
Product launches work the same way, except the stakes are higher. When I am wrong on a trade, I close the position in seconds. You cannot close a failed product launch in seconds — you are stuck holding unsold inventory and an uncomfortable conversation with whoever invested in your “sure thing.”
And yet every week I watch smart, educated, motivated people pour their savings into a product without running basic pre launch market research. No surveys. No questionnaires. Just raw confidence and a business plan written at 11pm that their cousin said looked “fire.”
Their cousin is eating your food and using your Netflix. That is not market validation.
Here is what the data says. Research in Cogent Business and Management (2022) confirmed that market orientation — including structured pre-launch research — is a critical resource that directly elevates new product performance and launch quality (Ghasemzadeh et al., Cogent Business & Management, 2022, 9(1)). Translation: companies that ask customers what they want before building do significantly better than companies that guess.
Additionally, a Harvard Business School analysis cited widely across product development literature found that approximately 95% of new products launched globally fail (Bismart Research Summary, 2024, citing HBS). Ninety-five percent. That is not a failure rate. That is a warning label. That is the universe putting its hand on your shoulder and saying “Hey. Ask some questions first.”
This guide gives you the theory, the structure, the questionnaire examples, the academic evidence, and the case studies. And because I am a trader who has seen too much to be polite, we are having some fun along the way.
Part One: What Is a Pre Launch Product Market Research Survey Questionnaire?
A pre launch product market research survey questionnaire is a structured set of questions you present to your target market before your product exists — before the factory runs, before the website goes live, before you spend a pound on packaging.
It is the business equivalent of checking the weather before a barbecue — except instead of checking for rain, you are checking if anyone is going to show up.
Now I know what some of you are thinking. “I did my research. I talked to my girlfriend, my brother, and three people from my gym. They were all excited.” Brilliant. Your girlfriend needs peace in the house. Your brother wants to borrow money later. None of these people are your market. They are your emotional support group, but they are not about to open their wallets at retail price with zero obligation.
Real pre-launch research means structured, unbiased data collection from people who have no social contract to be kind to you. Strangers. Glorious, honest, occasionally brutal strangers. That is where the survey comes in.
Griffin and Hauser (1993) in Marketing Science, who developed the “voice of the customer” concept, established that systematically collecting consumer input before development significantly improves the alignment between product features and customer needs, correlating directly with commercial success (Griffin & Hauser, Marketing Science, 1993, 12(1), 1–27). The core principle has never stopped being true: ask first, build second.
Part Two: The Anatomy of a Pre Launch Survey — What You Actually Need
A strong pre launch survey is not a random list of questions you fire off while eating a meal deal. It has architecture — moving from broad to specific, building trust before the hard questions. Think of it like a good investment thesis: you do not start with the conclusion.
Here are the eight essential sections every pre-launch survey needs:
- Demographics and Respondent Profiling
- Problem and Pain Point Validation
- Awareness and Current Behaviour
- Concept and Product Idea Testing
- Feature Prioritisation
- Pricing Sensitivity
- Purchase Intent
- Open-Ended Qualitative Feedback
One more thing before we dive in: pricing comes near the end, not the beginning, deliberately. Ask about price too early and you anchor respondents before they understand the problem, corrupting the data.
Let us go through each section in full, with real questionnaire examples you can use or adapt right now.
Part Three: Section-by-Section Questionnaire Examples with the Good Stuff
Section 1: Demographics and Respondent Profiling
Before you analyse a single response, know who you are talking to. Survey 19-year-old students for a premium B2B software product and your data will send you confidently into a wall.
Example Questions:
Q1. What is your age range?
- [ ] 18–24
- [ ] 25–34
- [ ] 35–44
- [ ] 45–54
- [ ] 55–64
- [ ] 65+
Q2. What is your gender?
- [ ] Male
- [ ] Female
- [ ] Non-binary / third gender
- [ ] Prefer to self-describe: ___________
- [ ] Prefer not to say
Q3. What is your approximate annual household income?
- [ ] Under £25,000
- [ ] £25,000–£49,999
- [ ] £50,000–£74,999
- [ ] £75,000–£99,999
- [ ] £100,000+
- [ ] Prefer not to say
Q4. Where do you primarily reside?
- [ ] Urban (city centre)
- [ ] Suburban
- [ ] Rural / semi-rural
Q5. What is your employment status?
- [ ] Employed full-time
- [ ] Employed part-time
- [ ] Self-employed / business owner
- [ ] Student
- [ ] Retired
- [ ] Unemployed / between roles
Demographic segmentation lets you cross-tabulate everything else later. You might find 18–24 year-olds love your concept but cannot afford it, while 40–55 year-olds are lukewarm but have the budget and the problem. That information changes your entire go-to-market strategy. Wedel and Kamakura (2000) established that demographic profiling reduces post-launch acquisition costs by enabling precise targeting from day one (Wedel & Kamakura, Market Segmentation, 2nd ed., Kluwer, 2000).
Section 2: Problem and Pain Point Validation
This is the most important section in your entire survey — said with the full weight of someone who has watched too many businesses fail solving problems that did not actually hurt anybody.
Here is something the market will never tell you gently: people do not buy products, they buy relief from recurring, genuinely irritating problems. If the problem ranks a 4 out of 10 in daily life, you do not have a market, you have a curiosity. Nobody opens their wallet for a minor inconvenience.
Remember the Juicero — the startup that raised $100 million to build a $400 Wi-Fi juicer, only for journalists to reveal the juice packs could simply be squeezed by hand? Pain point validation would have caught this before anyone lost a dollar. Instead they lost over $100 million. I will let you sit with that.
Example Questions:
Q6. How often do you experience [the specific problem your product addresses]?
- [ ] Daily
- [ ] Several times a week
- [ ] About once a week
- [ ] A few times a month
- [ ] Rarely
- [ ] Never
Q7. On a scale of 1–10, how significantly does this problem affect your daily life or work? (1 = Barely notice it, 10 = It is genuinely disrupting my life)
Q8. What are you currently doing to deal with this problem? (Select all that apply)
- [ ] Using a competitor’s product (please name it): ___________
- [ ] Using a DIY or makeshift solution
- [ ] Doing nothing — I have not found a solution
- [ ] I have stopped trying to solve it
- [ ] Other: ___________
Q9. How satisfied are you with your current approach?
- [ ] Very satisfied
- [ ] Somewhat satisfied
- [ ] Neutral
- [ ] Somewhat dissatisfied
- [ ] Very dissatisfied
Q10. In your own words, what frustrates you most about the options currently available to you? (Open text)
Urban, Hauser, and Dholakia (1987) found that products addressing high-frequency, high-intensity problems showed significantly higher adoption than those targeting minor pain points (Urban, Hauser & Dholakia, Prentice-Hall, 1987). Daily problem, severity eight or nine — genuine demand. Monthly, severity five — a feature request at best.
Section 3: Awareness and Current Behaviour
Now map the existing landscape. What does your target market already know? What are they already buying? How much wallet space does this category currently occupy in their lives?
As a trader, I never enter a position without understanding the existing market structure — who the major players are, what the volume and sentiment look like. You are doing the same thing here.
Example Questions:
Q11. How familiar are you with products in the [your product category] space?
- [ ] Very familiar — I use them regularly
- [ ] Somewhat familiar — I have tried a few
- [ ] Slightly familiar — I have heard of some but never used them
- [ ] Not familiar at all — this is new to me
Q12. Which of the following brands or products in this category are you aware of? (Select all that apply)
- [ ] [Competitor A]
- [ ] [Competitor B]
- [ ] [Competitor C]
- [ ] None of the above
- [ ] Other: ___________
Q13. Approximately how much do you spend per month on products or services in this category?
- [ ] I spend nothing — I do not buy in this category
- [ ] Less than £20 per month
- [ ] £20–£50 per month
- [ ] £51–£100 per month
- [ ] More than £100 per month
Q14. Where do you typically purchase products in this category? (Select all that apply)
- [ ] Online — Amazon or major marketplace
- [ ] Online — directly from the brand’s website
- [ ] Physical retail (supermarket, pharmacy, or specialist store)
- [ ] Subscription service
- [ ] I do not currently purchase in this category
This tells you everything about the battle ahead. If 80% of respondents already use a market leader and rate it highly, you need to know what would make them switch. If 80% have never purchased in this category, you are in an education play — longer and more expensive than disrupting an existing category. Know which one you are in before you spend a penny.
Section 4: Concept and Product Idea Testing
Here is where it gets real. Present your actual concept — a description, a mock-up, a prototype photo — and measure the reaction. This is concept testing, one of the most powerful pre-launch tools because it removes your rose-tinted glasses and replaces them with the honest eyes of a stranger who has no idea how many nights you spent on this idea.
(Present your concept here: two to three sentences on what the product does, who it is for, and what makes it different. Include an image wherever possible.)
Q15. After reading the description above, what best describes your initial reaction to this product?
- [ ] Very excited — I would want this immediately
- [ ] Intrigued — I want to learn more before deciding
- [ ] Neutral — not sure if it is for me
- [ ] Unlikely to appeal to me personally
- [ ] This would not be something I would consider using
Q16. Which of the following words best describe how this concept makes you feel? (Select up to three)
- [ ] Innovative
- [ ] Convenient
- [ ] Trustworthy
- [ ] Overpriced
- [ ] Unnecessary
- [ ] Exciting
- [ ] Confusing
- [ ] Clever
- [ ] Risky
- [ ] Simple and practical
Q17. What do you like most about this concept? (Open text)
Q18. What concerns or reservations, if any, do you have? (Open text)
Q19. Does this product clearly address a problem you have personally encountered?
- [ ] Yes, absolutely
- [ ] Somewhat
- [ ] Not really
- [ ] Not at all
Dahan and Hauser (2002) in Marketing Science demonstrated that digital concept testing produces predictive validity comparable to physical prototype testing at a fraction of the cost (Dahan & Hauser, Marketing Science, 2002, 21(3), 255–368). You need a clear description and the humility to accept what the data shows you.
Section 5: Feature Prioritisation
Not every feature you dreamed up is equally valued by the people you intend to sell to. I know that lands like a wet slap. You have lived with this list for months, believing in every item with the energy of someone three coffees deep into a revelation.
The market does not care about your revelation. It cares about solving its problem efficiently. Find out which features are “must haves,” which are “nice to haves,” and which ones — said kindly — nobody asked for.
Q20. Below is a list of planned features for this product. Please rate each one based on how important it is to you personally. (Scale: 1 = Not important at all → 5 = Extremely important)
| Feature | 1 | 2 | 3 | 4 | 5 |
|---|---|---|---|---|---|
| [Feature A] | ○ | ○ | ○ | ○ | ○ |
| [Feature B] | ○ | ○ | ○ | ○ | ○ |
| [Feature C] | ○ | ○ | ○ | ○ | ○ |
| [Feature D] | ○ | ○ | ○ | ○ | ○ |
| [Feature E] | ○ | ○ | ○ | ○ | ○ |
Q21. If you could only have THREE of the features listed above, which would you choose? (Select exactly three)
Q22. Is there a feature you would strongly want that is not listed above? (Open text)
This question alone has saved more product roadmaps than any other line in this questionnaire — respondents often surface features founders never considered.
The Kano Model, developed by Professor Noriaki Kano (1984), classifies features as basic needs, performance needs, or delighters. Mapping responses against this model lets you allocate budget with precision instead of instinct (Kano et al., Journal of the Japanese Society for Quality Control, 1984, 14(2), 39–48).
Section 6: Pricing Sensitivity
Now we are in my territory — money. Price is a signal, not just a number. Too cheap and people assume something is wrong; too expensive and they walk away. The “acceptable range” between those points is what you are hunting for.
The best tool for this is the Van Westendorp Price Sensitivity Meter — a four-question methodology developed by Dutch economist Peter Van Westendorp in 1976 that identifies your acceptable price range without anchoring respondents to a number you have already decided on. It lets the data lead, which is always the correct approach.
Q23. At what price would this product be so cheap that you would question its quality? £ ___________
Q24. At what price would this product feel like a genuine bargain — excellent value for your money? £ ___________
Q25. At what price would this product start to feel expensive, but you might still consider purchasing it? £ ___________
Q26. At what price would this product be too expensive for you to consider purchasing under any circumstances? £ ___________
Q27. Which pricing model would most appeal to you for this type of product?
- [ ] One-time purchase — pay once, own it forever
- [ ] Monthly subscription
- [ ] Annual subscription (with discount over monthly pricing)
- [ ] Pay-per-use
- [ ] Freemium — basic version free, premium features paid
Q28. Would a free trial meaningfully influence your likelihood of purchasing?
- [ ] Yes — I am much more likely to buy after trying it at no cost
- [ ] Somewhat — it helps, but it is not essential to my decision
- [ ] No — I am comfortable buying based on a strong product description alone
Pricing is the most reversible decision in your launch plan, yet founders agonise over it most while testing it least. Get it right here and you will not need to guess later.
Van Westendorp’s methodology, validated across decades of consumer research, produces an “acceptable price range” without the bias of showing respondents an anchor price first (Van Westendorp, ESOMAR Congress Proceedings, Venice, 1976). Dost et al. (2014) validated the model’s applicability in digital and subscription contexts (Dost et al., International Journal of Research in Marketing, 2014, 31(1)).
Section 7: Purchase Intent
Now the moment of truth: do positive signals translate into something real, or are respondents just politely encouraging you the way family does — warm, supportive, not buying anything?
Interest is not a position. Purchase intent measures the actual probability a real human opens a real wallet — and those two things diverge more often than anyone admits.
Q29. Based on everything you have read about this product, how likely are you to purchase it when it becomes available?
- [ ] Definitely will purchase
- [ ] Probably will purchase
- [ ] Might or might not purchase
- [ ] Probably will not purchase
- [ ] Definitely will not purchase
Q30. If you would not purchase this product, what is the primary reason? (Select the most applicable)
- [ ] It is priced too high for what it offers
- [ ] It does not solve a problem I personally have
- [ ] I already use a competitor product I am happy with
- [ ] I do not feel I can trust a new brand in this space yet
- [ ] The features listed do not match what I would need
- [ ] Other: ___________
Q31. Would you recommend this product to a friend or colleague if it performed as described?
- [ ] Definitely yes
- [ ] Probably yes
- [ ] Unsure
- [ ] Probably not
- [ ] Definitely not
Q32. How soon after launch would you be likely to make a purchase, assuming the product met your expectations fully?
- [ ] Immediately — I would be a Day 1 buyer
- [ ] Within the first month of launch
- [ ] Within three months
- [ ] Within six months
- [ ] After six months — I prefer to see reviews and social proof first
This five-point format is based on the Juster Scale, established by economist F.T. Juster (1966), who showed in The American Economic Review that probability-of-purchase questions significantly outperform binary yes/no questions in predicting actual purchasing behaviour (Juster, The American Economic Review, 1966, 56(1/2), 538–545). Replicated for nearly sixty years. Use the Juster Scale.
Section 8: Open-Ended Qualitative Feedback
This is where the gold hides. No Likert scale captures the texture of genuine frustration — and a potential customer who writes three paragraphs about what bothers them about your concept is worth more than a hundred ticked boxes. That paragraph contains real language, real objections, and real messaging you can use.
Read every open-ended response, especially the ones that sting.
Q33. Is there anything about this product concept we have not addressed that you feel is important to share? (Open text)
Q34. What would need to change about this product to make it an absolute must-have for you personally? (Open text)
Q35. If you were describing this product to a friend in one sentence, what would you say? (Open text — pure copywriting gold)
Q36. Any additional thoughts, concerns, suggestions, or general feedback you would like to share? (Open text)
Part Four: Case Studies — What Actually Happened When the Research Was Done
Case Study 1: Dropbox — Concept Validation Before a Single Line of Code
Before Dropbox built any significant infrastructure, founder Drew Houston created a simple explainer video describing what the product would do and pointed viewers to a waiting list page. No finished product. No app. Just a clear concept, distributed to the right audience.
The waiting list grew from 5,000 to 75,000 signups overnight. That was the market research, expressed in email addresses rather than checkbox data. Dropbox subsequently used structured questionnaires during development to prioritise features and validate pricing. By launch, they had pre-validated demand and understood their audience’s needs and acceptable price points — achieving strong product-market fit because the market had essentially helped build the product (Harvard Business Review, Product Launch Strategy, 2019).
The lesson is simple: concept validation before development is not a luxury. It is the smartest money you will ever spend on knowing whether the product is worth building at all.
Case Study 2: New Coke — When You Ask the Wrong Questions
In 1985, Coca-Cola conducted extensive market research before launching New Coke. The blind taste tests were thorough, the sample sizes significant, the methodology sound. Every data point showed consumers preferred the sweeter new formula in blind testing.
So what went catastrophically wrong?
They asked “Do you prefer this taste?” They never asked how people would feel about permanently losing the original. They validated the flavour and completely failed to validate brand attachment. The backlash was so severe — boycotts, protests, thousands of daily angry calls — that the company reintroduced the original formula as “Coca-Cola Classic” within 79 days.
Schindler (1992) identified this as technically valid methodology producing catastrophically misleading results, because it failed to capture the emotional dimensions of brand attachment (Schindler, Psychology & Marketing, 1992, 9(6), 683–694). The research did not fail; the question design failed.
Case Study 3: Glossier — When Your Audience Is Your Research Panel
Emily Weiss built a beauty blog called Into The Gloss before she built Glossier. For years before launch, she published content, ran polls, and systematically collected qualitative feedback from a highly engaged audience of beauty consumers.
By the time Glossier launched its first four products in 2014, she had effectively run a multi-year market research programme with her exact target demographic — the community itself had become the research instrument. All four initial products sold out, and within five years the company was valued at over one billion dollars, not through luck but through a product development process inseparable from continuous conversation with the intended customer (Forbes, Glossier Brand Story, 2019).
The lesson is that pre-launch research does not have to look like a formal survey. It has to look like genuine, sustained listening to your market. The survey is the tool. The listening is the discipline.
Part Five: How to Distribute Your Survey — And Mistakes That Will Destroy Your Data
Getting the questionnaire right is half the job. Getting it to the right people is the other half — where solid research often goes wrong.
Where to Send It:
- Pre-launch email list — Your warmest and most relevant audience. Use it first.
- Paid social media targeting — Meta and LinkedIn let you reach your exact demographic. Specify tightly; do not waste budget on broad reach.
- Reddit and niche online communities — People on Reddit will give you feedback that is honest, occasionally brutal, and absolutely invaluable. Post in relevant subreddits with genuine transparency. The community will respond.
- Qualtrics panels or SurveyMonkey Audience — Research-grade respondent pools with demographic controls. The most rigorous route and costs accordingly.
Mistakes That Will Ruin Your Dataset:
Mistake One: Leading questions. “Don’t you agree our product is far superior?” is a sponsored post in disguise. Neutral language is non-negotiable.
Mistake Two: Running it too long. Completion quality drops sharply after seven to eight minutes (SuperSurvey Research Guidelines, 2025). Aim for ten to twenty focused questions.
Mistake Three: Surveying only your existing audience. Your followers already lean positive toward you — survivorship bias wearing a clipboard. You need honest feedback from people with no prior relationship to your brand.
Mistake Four: Cherry-picking results. Ego battles intelligence here, and ego wins too often. If 55% say they would not purchase, that is not an outlier — it is your primary finding.
Mistake Five: Not piloting first. Run it with five to ten people before full launch and flag confusing questions. One badly worded question can corrupt your entire dataset (Circana Pre-Launch Research Guide, 2025).
Part Six: Reading the Data — How to Turn Survey Responses into Actual Decisions
The data is in. The spreadsheet is full. This is where traders and non-traders split. A trader looks at a chart and sees structure, momentum, divergence, confirmation. A non-trader sees lines. Your survey data is no different.
The Metrics:
Purchase Intent Score: Add “Definitely will purchase” and “Probably will purchase.” A combined score of 40% or above is a strong signal (Greenbook, 2025). Under 25% means revisit your concept first.
Problem Severity Average: If the mean sits below 6 out of 10, the problem is not causing enough disruption to reliably drive purchases. Reconsider the problem or the audience.
Optimal Price Point: Plot your Van Westendorp data. The “acceptable range” sits between the “too cheap” and “too expensive” crossover points — your starting pricing hypothesis.
Feature Priority Ranking: Sort features by average importance score. Build what scores 4.5 and above first; reconsider anything below 3. Build what your market values, not what your team finds most interesting.
Segment Cross-Tabulation: Filter purchase intent by demographic segment. If 35–44 year-olds show 60% intent versus 12% for 18–24 year-olds, your launch audience is clear.
Kohavi and Thomke (2017) in Harvard Business Review argued that organisations that outperform at launch are not those with the best products, but those with the most rigorous systems for gathering and acting on consumer data (Kohavi & Thomke, Harvard Business Review, 2017). Collecting data is half the advantage; acting on it is the other half.
Conclusion: Your Survey Is Your Edge
Let me bring this home the way I bring every trade home — with the clearest view of what the data tells me, and a decision.
The pre launch product market research survey questionnaire is not a formality or a box to tick before you do what you were going to do anyway. It is the single most cost-effective investment available to anyone building a new product — the difference between entering the market with knowledge and entering it with hope.
In trading, we say: “Trade what you see, not what you think.” The market does not care what you believe will happen; it cares what the data shows. Your survey is how you learn what your market genuinely wants and is willing to pay for — before committing resources you cannot get back.
The best outcome is confirmation of a strong concept and clear launch path. The second-best is discovering you need to pivot. The third-best — and do not laugh, this one saves people everything — is discovering the idea lacks the market you thought it had, before spending the money to find out the hard way.
All three outcomes are valuable. All three cost less than ignoring the process entirely.
Run your survey. Read the data. Listen to what your market is telling you — especially when it is telling you something you did not want to hear. The market has been right about your product since before you started building it. The survey is how you finally hear what it has been saying all along.
Now go ask your questions. The market is waiting.
Frequently Asked Questions
1. What is a pre launch product market research survey questionnaire?
It is a structured set of questions used to gather feedback from your target market before a product is built or launched, validating demand, pricing, and features in advance.
2. Why is pre launch market research important?
It significantly reduces the risk of product failure by revealing whether real customers actually want, need, and will pay for what you are building.
3. How many questions should a pre launch survey include?
Aim for 15 to 25 focused questions, since response quality drops sharply once a survey takes longer than seven to eight minutes to complete.
4. How many respondents do I need for reliable results?
A minimum of 100 respondents works for niche products, while 300 to 500 respondents is recommended for broader consumer categories.
5. What is the Van Westendorp Price Sensitivity Meter?
It is a four-question pricing methodology that identifies the acceptable price range for a product without anchoring respondents to a specific number.
6. What is concept testing in market research?
Concept testing involves presenting a product description or mock-up to respondents and measuring their reaction before any significant development investment is made.
7. Should I survey my existing customers or followers?
No, relying only on existing followers introduces survivorship bias, so you should prioritize reaching people unfamiliar with your brand for honest, unbiased feedback.
8. What is purchase intent and why does it matter?
Purchase intent measures the actual likelihood that a respondent will buy your product, which is a more reliable predictor of success than general enthusiasm or interest.
9. What is the Kano Model used for in product surveys?
The Kano Model helps classify product features into basic needs, performance needs, and delighters, allowing you to prioritize development based on real customer value.
10. Can I use AI to analyze pre launch survey results?
Yes, AI tools can effectively perform sentiment analysis and identify patterns in open-ended responses, though human judgment should still guide the final interpretation.
References
- Ghasemzadeh, P., Nazari, M., Farzaneh, M. & Mehralian, G. (2022). The impact of market orientation on new product performance through product launch quality: A resource-based view. Cogent Business & Management, 9(1). https://doi.org/10.1080/23311975.2022.2108220
- Griffin, A. & Hauser, J.R. (1993). The Voice of the Customer. Marketing Science, 12(1), 1–27. https://doi.org/10.1287/mksc.12.1.1
- Wedel, M. & Kamakura, W.A. (2000). Market Segmentation: Conceptual and Methodological Foundations (2nd ed.). Kluwer Academic Publishers. https://link.springer.com/book/10.1007/978-1-4615-4651-1
- Urban, G.L., Hauser, J.R. & Dholakia, N. (1987). Essentials of New Product Management. Prentice-Hall. https://www.worldcat.org/title/essentials-of-new-product-management/oclc/13525770
- Dahan, E. & Hauser, J.R. (2002). The Virtual Customer. Marketing Science, 21(3), 255–368. https://doi.org/10.1287/mksc.21.3.255.135
- Kano, N., Seraku, N., Takahashi, F. & Tsuji, S. (1984). Attractive Quality and Must-Be Quality. Journal of the Japanese Society for Quality Control, 14(2), 39–48. https://www.tandfonline.com/doi/abs/10.1080/09544120600997084
- Van Westendorp, P. (1976). NSS-Price Sensitivity Meter (PSM) — A new approach to study consumer perception of price. ESOMAR Congress Proceedings, Venice, 139–167. https://esomar.org
- Dost, F., Geyer-Schulz, A. & Natter, M. (2014). The Van Westendorp Price Sensitivity Meter in digital product contexts. International Journal of Research in Marketing, 31(1). https://doi.org/10.1016/j.ijresmar.2013.07.002
- Juster, F.T. (1966). Consumer Buying Intentions and Purchase Probability. The American Economic Review, 56(1/2), 538–545. https://www.jstor.org/stable/1821325
- Schindler, R.M. (1992). The real lesson of New Coke: The value of focus groups for predicting the effects of social influence. Psychology & Marketing, 9(6), 683–694. https://doi.org/10.1002/mar.4220090603
- Kohavi, R. & Thomke, S. (2017). The Surprising Power of Online Experiments. Harvard Business Review, September–October 2017. https://hbr.org/2017/09/the-surprising-power-of-online-experiments
- Greenbook (2025). How to Use Market Research Surveys for New Product Development. https://www.greenbook.org/insights/product-development/how-to-use-market-research-surveys-for-new-product-development
- SuperSurvey (2025). New Product Market Research Survey Questions. https://www.supersurvey.com/LPC-new-product-market-research
- Circana (2025). How to Do Market Research Before Developing or Launching New Products. https://www.circana.com/post/how-to-do-market-research-before-developing-or-launching-new-products
- Bismart (2024). 10 Questions We Must Ask Before Launching a Product or Service. https://blog.bismart.com/en/kale/10-questions-before-launching-a-new-product-or-service
Disclaimer: This article is for educational and informational purposes. Always conduct your own due diligence before making strategic business decisions — and for the love of everything, update your competitive research more than once a decade. The market waits for no one. Neither do your competitors. But now, neither do you.
Leave a Reply
You must be logged in to post a comment.