

As of: September 8, 2026, 17:53 UTC+1 Spot Price: ~$225.85–$226.01 Timeframes Analyzed: Weekly | Daily | 4-Hour | 1-Hour Indicators: Bollinger Bands (20, SMA, 2 std dev) | RSI (14, close)
NVIDIA is testing a critical $233–$234 resistance confluence across the Weekly, Daily, and 4H charts, with short-term momentum fading even as the broader multi-month uptrend remains intact. This analysis breaks down the multi-timeframe structure, key confluence zones, and two actionable trade setups—a tactical short at resistance and a buy-the-dip continuation play.
1. Multi-Timeframe Structural Analysis
🗓️ Weekly
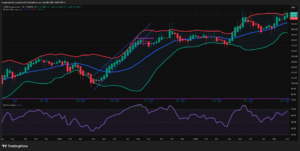
- Structure: Powerful, uninterrupted primary uptrend since the April 2025 low (~$86). Clear sequence of Higher Highs / Higher Lows, interrupted only by one major corrective leg (Nov 2025–Apr 2026, ~$212 → ~$86) before resuming.
- Key Levels: Prior swing highs at ~$200 and ~$212 (Aug–Sep 2025) now act as distant support; the rising trendline from the April 2025 low remains intact. Price is currently pressing into all-time-high territory (~$233.71).
- Bollinger Bands: Price is riding the upper band with the bands in clear expansion, a hallmark of trending (not mean-reverting) behavior. No compression/squeeze visible — volatility is being expressed, not stored.
📅 Daily
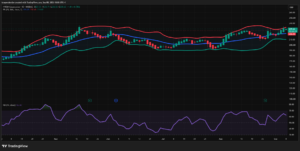
- Structure: Bullish but choppier — a stair-step pattern of rally → consolidation → rally. Sequence: rally to $233 (mid-May) → pullback to $188 (late Jun) → rally to $208 (late Jul) → pullback to $188 (late Aug) → sharp rally to new highs $233.71 (early Sep), now retracing to $225.92.
- Key Levels: $233 is a double-top style resistance cluster (mid-May high vs. early-Sep high) — a critical level to watch. $220–221 (basis SMA) and $212 are the nearest supports.
- Bollinger Bands: Price tagged the upper band and is now curling back toward the 20-SMA (~$221.23) — a classic post-expansion mean-reversion pullback within an uptrend.
⏱️ 4-Hour
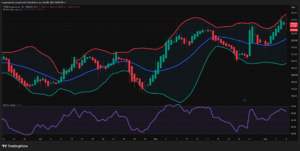
- Structure: Bullish, but with a visible correction from ~$233 (mid-Aug) down to ~$208 (Aug 25–27) before an explosive reversal candle. Since then, higher highs to $233.71.
- Key Levels: $220 (recent breakout base) is now first support; $208–212 is the deeper structural floor from the August pullback.
- Bollinger Bands: The large reversal candle straddled/broke above the upper band (a band “walk” event), then price re-based along the mid/upper band — bands widening again on the push, now starting to contract slightly as momentum cools.
🕐 1-Hour
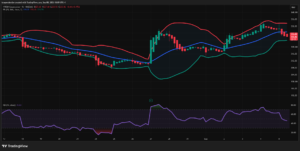
- Structure: Choppier mean-reverting swings inside the broader uptrend. Pattern: decline Aug 18–24 ($228→$208), sharp reversal (earnings gap, marked “E”) on Aug 27, rally to $232, pullback to $218 (Sep 1–2), second explosive rally to $234 (Sep 4), now correcting to $225.85.
- Key Levels: $224 (SMA) and $220 support; $228–230 near-term resistance (former breakout shelf).
- Bollinger Bands: Price has fallen from riding the upper band to now sitting below the basis SMA, inside the lower half of the bands — short-term momentum has clearly cooled and band width is starting to narrow (contraction developing).
2. Price Action & Candlestick Patterns
- Daily: The most recent candle is a bearish engulfing-style rejection from the $233 double-top zone — price opened near the high, was rejected, and closed near session lows (-0.82%). This sits directly at the same resistance shelf as the mid-May top, reinforcing a potential double-top structure.
- 4H: The Aug 27 candle is a large bullish marubozu/engulfing bar off the $208 low, printed exactly at the lower Bollinger Band — a classic volatility-expansion reversal candle (likely earnings-related, given the “E” annotation).
- 1H: Multiple small-bodied reversal candles (dojis/spinning tops) cluster around $232–234 on Sep 4, signaling exhaustion at the highs before the current pullback. The Aug 27 1H candle mirrors the 4H bullish reversal bar off the lower band.
- Chart Patterns:
- Daily/Weekly: A rising channel is visible on the weekly chart (parallel trendlines from the 2025 rally), with price now testing the upper channel boundary — a location historically associated with stalls/pullbacks.
- Daily: The two roughly equal highs at $233 (May) and $233.71 (Sep) form an early-stage double top — not confirmed until a break below the $205–208 “neckline” support zone.
- 4H/1H: A flag/pennant-like consolidation is forming just under the highs as the market digests the recent rally.
3. RSI Momentum & Divergence Analysis
| Timeframe | RSI (14) | Zone | Notes |
|---|---|---|---|
| Weekly | 66.39 | Bullish, not yet overbought | Rising alongside price — no divergence; confirms trend health |
| Daily | 62.26 | Neutral-bullish | Rolling over slightly from a recent peak >70; watch for regular bearish divergence if price makes a new high but RSI doesn’t |
| 4H | 62.70 | Neutral-bullish | Pulled back from ~68–70 peak; still above the 50 midline |
| 1H | 45.79 | Neutral, below 50 | Sharp drop from ~78 (Sep 4 peak) — classic short-term momentum unwind |
- Divergence Watch: On the Daily, the Sep high (~$233.71) is essentially equal to the May high (~$233) — but the RSI printed a comparatively muted secondary peak versus its earlier surge. This is an early warning sign of regular bearish divergence at the double-top zone, though not yet fully confirmed.
- Hidden Divergence: On the 4H, the Aug 25–27 price low ($208) held above the immediate swing structure while RSI stayed above its late-July trough — consistent with hidden bullish divergence, supporting trend continuation, which is exactly what played out (explosive rally).
- Midline Confluence: Daily and 4H RSI both found support bouncing from the 40–45 zone during pullbacks (Aug lows) — the 50 line is acting as dynamic support in the uptrend, a bullish structural tell.
4. Technical Confluence Synthesis
Bullish confluence (trend continuation):
- Weekly uptrend + expanding upper-band ride = dominant bullish regime.
- 4H hidden bullish divergence at the Aug 27 low + explosive reversal candle off the lower band = the fuel behind the current leg to all-time highs.
- Daily/4H RSI holding the 50 midline on pullbacks = healthy trend behavior, not distribution.
Bearish/caution confluence (near-term resistance):
- Daily double top at ~$233 coinciding with the Weekly upper channel boundary and the Weekly upper Bollinger Band — three timeframes agreeing on a supply zone at $233–234.
- 1H RSI collapse from 78 to 46 + Daily bearish rejection candle at that same $233 zone = short-term sellers are currently in control at resistance.
- This creates a high-probability zone for a corrective pullback toward $220 (Daily/4H SMA confluence) to $208–212 (structural support / prior breakout base) before the broader uptrend can resume.
Overall read: The dominant multi-week/multi-month trend remains firmly bullish, but price is currently sitting at a well-defined, multi-timeframe resistance/double-top confluence with fading short-term momentum — favoring a tactical pullback/consolidation before any fresh leg higher.
5. Sentiment Score & Catalysts
Sentiment Gauge: 🟢 Bullish (Long-Term) / 🟡 Neutral-to-Cautious (Short-Term)
Key Catalysts
- Nvidia’s fiscal 2027 second quarter (ended July 26) delivered year-over-year revenue growth of 106% to $96.2 billion, with diluted EPS up 128% to $2.46 — both ahead of Wall Street estimates, sending shares up roughly 8% in the aftermath. (The Motley Fool)
- Nvidia shares rose after the company agreed to acquire AI developer platform Hugging Face for a total consideration of about $12.9 billion, a move described as more defensive positioning than a pure chip play. (CNBC)
- Nvidia’s FY2026 revenue reached $215.94 billion (+65.47% YoY), with earnings up 64.75%, and the company recently surpassed a $5 trillion market capitalization. (StockAnalysis.com)
- Next scheduled earnings date is estimated around November 20, 2026. (CNBC)
🟢 Bullish Drivers
- Blackwell/Vera Rubin demand cycle continues to run ahead of estimates, per record Q2 results. (The Motley Fool)
- Analyst consensus remains “Strong Buy” across roughly 60 analysts, with a 12-month price target near $326, implying substantial perceived upside. (StockAnalysis.com)
- Continued hyperscaler capex commitments to AI infrastructure support the demand narrative. (Finbold)
🔴 Bearish Drivers
- A Nvidia board member recently sold roughly $410 million of company stock — a notable insider-selling headline that can weigh on short-term sentiment. (Robinhood/NVDA)
- Peer Broadcom fell after issuing weaker-than-expected Q4 FY2026 revenue guidance, raising some read-through concern about AI-hardware spending pacing. (Yahoo Finance / Zacks)
- Seasonality is a mild headwind: over 2016–2025, Nvidia’s stock has historically declined an average of about 0.8% in September. (The Motley Fool)
- Valuation is elevated after the parabolic 2025–2026 move, leaving the stock vulnerable to sharper pullbacks on any growth-rate disappointment.
6. Final Actionable Trading Ideas
💡 Idea 1 — Short-Term Pullback / Mean-Reversion Short (Day Trade / Swing)
- Direction: Short (Sell), tactical
- Strategic Rationale: Price is rejecting the $233–234 zone where the Daily double-top, Weekly upper channel line, and Weekly upper Bollinger Band all converge, while 1H RSI has already broken down from overbought (78) to sub-50 — a classic multi-timeframe resistance rejection.
- Execution Triggers: Wait for a 1H candle to close below the 1H 20-SMA (~$224) with RSI failing to reclaim 50, confirming momentum has flipped negative; ideally enter on a retest of broken support turned resistance near $228–229.
- Risk Management:
- Stop Loss: Above $234 (invalidates the double-top thesis — a close back above the all-time high negates the rejection pattern).
- T1: $220 (Daily/4H 20-SMA confluence).
- T2: $208–212 (4H/1H structural support, site of the late-August low and prior breakout base).
💡 Idea 2 — Buy-the-Dip Continuation (Swing Trade, Higher Timeframe)
- Direction: Long (Buy), on confirmed pullback completion
- Strategic Rationale: The dominant Weekly/Daily trend remains firmly bullish with expanding bands and RSI holding above the 50 midline on every pullback; the 4H hidden bullish divergence pattern that fueled the last rally suggests dips are being bought aggressively in this regime.
- Execution Triggers: Look for price to reach the $208–220 confluence zone (Daily SMA / prior 4H structure) and print a bullish reversal candle (hammer/engulfing) with 4H RSI holding above 40 and turning back up through 50.
- Risk Management:
- Stop Loss: Below $205 (below the late-August structural low, which would break the Higher-Low sequence).
- T1: $228–230 (recent breakdown/resistance shelf).
- T2: $234+ (new all-time high, testing the double-top resistance again).
Sources
- The Motley Fool — “History Says This Is What Happens to Nvidia Stock in September”
- CNBC — NVDA Quote & News
- StockAnalysis.com — NVDA Overview
- Finbold — “AI predicts Nvidia (NVDA) price for September 30, 2026”
- Robinhood — NVDA Stock Price & News
- Yahoo Finance / Zacks Equity Research — “Company News for Sep 4, 2026”
This analysis is for informational/educational purposes only and does not constitute financial advice. Markets are probabilistic, not deterministic — always size positions according to your own risk tolerance and confirm signals with real-time price action before execution.
Leave a Reply
You must be logged in to post a comment.