
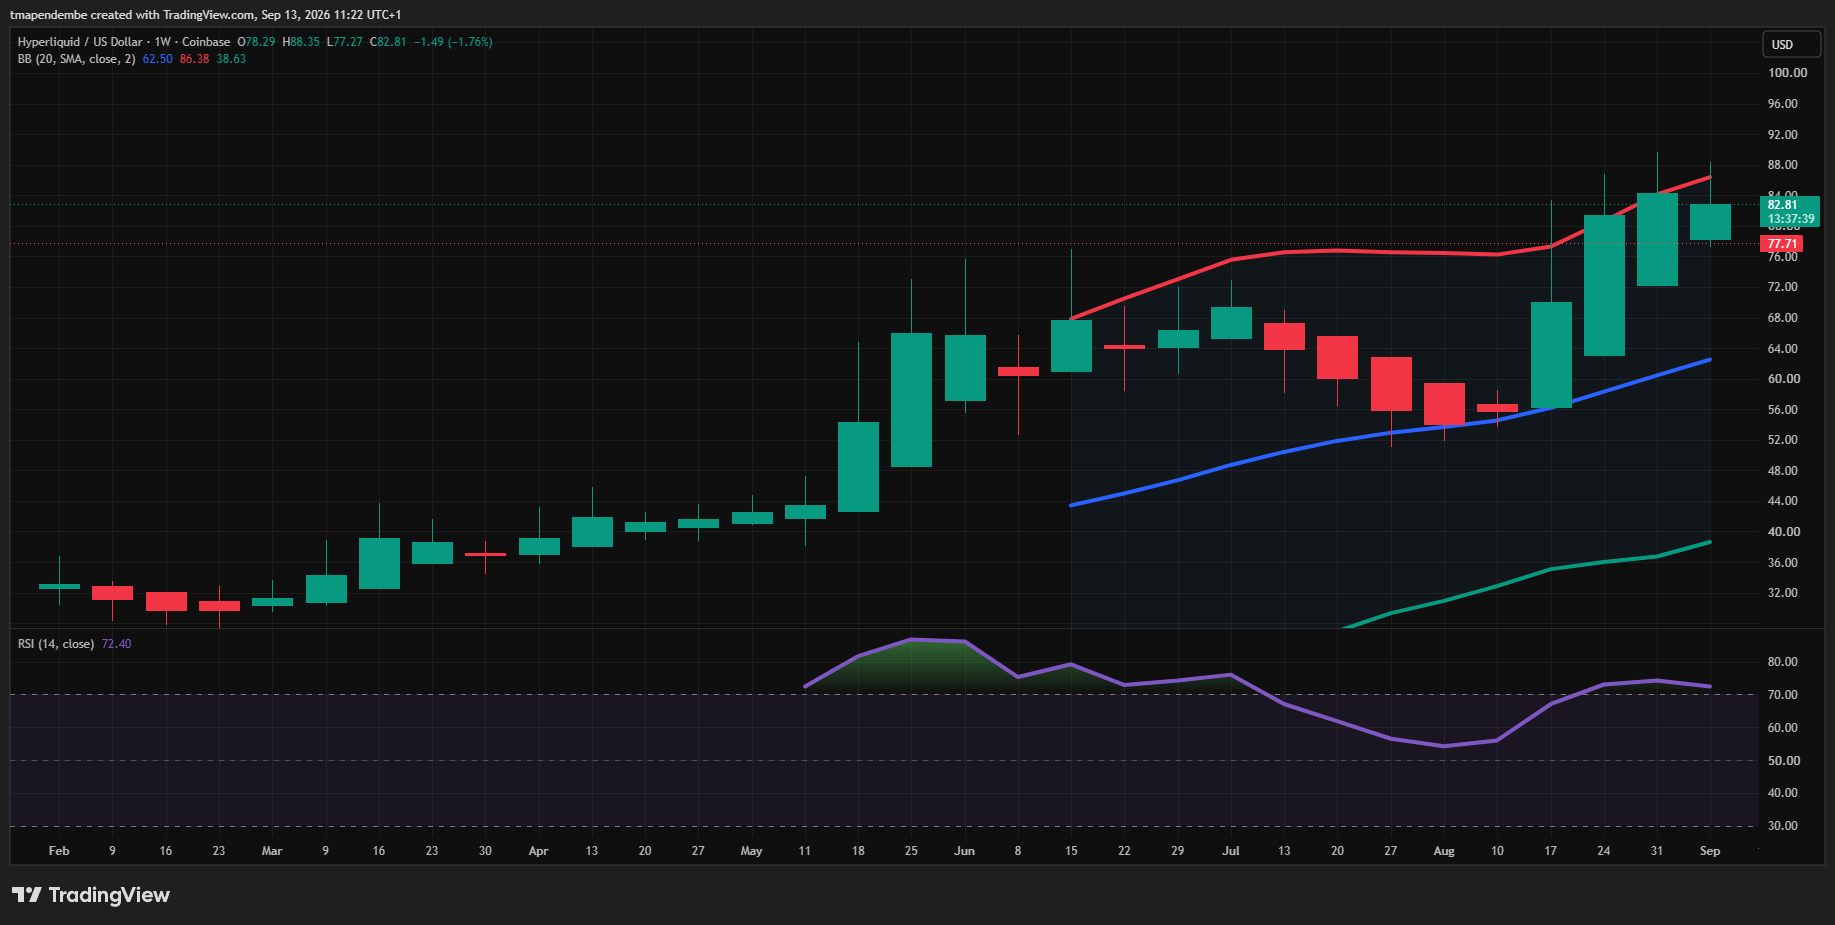
Weekly, Daily, 4H & 1H Bollinger Band + RSI Breakdown for the HYPE/USD Coinbase Pair
Hyperliquid (HYPE/USD) is in a pullback-within-an-uptrend: the Weekly and Daily charts remain structurally bullish but overbought, while the 4H shows a confirmed bearish divergence off a double top and the 1H is retesting a key $77–78 support cluster with early signs of bullish reversal. The confluence zone at $77–78 is the pivotal level — holding it favors a swing long back toward $83–88, while a clean break below $77 opens the door to a deeper correction toward $73–75.
Snapshot
| Timeframe | Last Close | BB Upper | BB Mid (20 SMA) | BB Lower | RSI (14) |
|---|---|---|---|---|---|
| Weekly | $82.85 (last full candle) / $77.88 current | 86.38 | 62.50 | 38.62 | 72.45 |
| Daily | $78.61 | 87.35 | 82.77 | 78.18 | 50.84 |
| 4H | $78.07 | 82.83 | 80.09 | 77.35 | 32.65 |
| 1H | $77.90 | 80.84 | 79.36 | 77.88 | 27.52 |
Bias at a glance: The higher timeframes (Weekly/Daily) remain structurally bullish but stretched and now cooling, while the lower timeframes (4H/1H) are in active corrective/oversold mode. This is a classic “pullback-within-an-uptrend” configuration rather than a confirmed trend reversal — provided key daily/weekly support holds.
1. Multi-Timeframe Structural Analysis
Weekly — Primary Trend: Bullish (Strong, Now Extended)
- Market Structure: A textbook impulsive uptrend since February — a sustained series of Higher Highs and Higher Lows, accelerating sharply from the ~$60 base in July/August into a parabolic push toward the high-$80s/low-$90s by early September. This is one of the cleanest multi-month trend structures on the chart set.
- Key Levels: Prior consolidation shelf around $60–65 (May–July basing zone) is now the “line in the sand” for the macro trend. The most recent psychological/technical resistance sits at the $88–89 swing high, with $100 as the next round-number magnet if that breaks. Immediate support/pivot is the prior breakout shelf near $77–78.
- Bollinger Bands: The bands are in full expansion, walking the upper band for several weeks — the hallmark of a strong trend, not a range. Price has now closed back inside the bands after tagging the upper edge, which is the first technical sign of trend deceleration rather than reversal.
Daily — Trend: Bullish, Currently in a Corrective Pullback
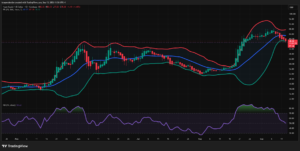
- Market Structure: Higher Highs/Higher Lows intact since the August low (~$52). Price spiked to a fresh high near $92 in early September before rejecting sharply — a clear blow-off/exhaustion move followed by profit-taking.
- Key Levels: Horizontal resistance at the $87–88 former all-time-high shelf (visible as a prior double-top zone from June as well — a level the market has now tested twice). Support sits at the $78 shelf (the base of the early-September breakout) and deeper at $70–72.
- Bollinger Bands: Price has round-tripped from the upper band (blow-off top) to the lower band (78.18) in the space of a week — a fast mean-reversion move. The bands are still wide (expansion phase), meaning volatility remains elevated; price is currently riding/testing the lower band, which in an uptrend context is typically where dip-buyers reassert control.
4H — Trend: Corrective Downtrend (Counter-Trend to Daily/Weekly)
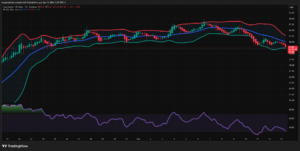
- Market Structure: A well-defined double top near $88 (Sept 4 and Sept 6–7 peaks) has resolved into a clean descending channel — Lower Highs and Lower Lows for the past week.
- Key Levels: Resistance now at the $80–81 broken-support-turned-resistance zone (former baseline). Support at $77–78, coinciding with the daily lower band.
- Bollinger Bands: Price is riding the lower band lower, confirming a persistent, orderly downtrend rather than a sharp capitulation — bands are moderately expanded but not extreme, suggesting a controlled unwind rather than panic selling.
1H — Trend: Short-Term Oversold / Range-Bound Chop
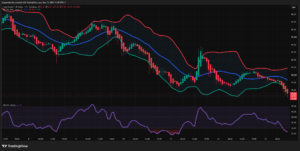
- Market Structure: A sharp decline from ~$87 (Sept 8) into the high-$70s, a bounce to ~$83 (Sept 11–12), and a fresh leg down into the current $77.90 print — effectively retesting the prior low.
- Key Levels: Immediate support at $77.86–78.00 (also the confluence of the daily and 4H lower bands — a high-significance zone). Resistance at $79.5–80 (blue basis line) and $82–83 (recent swing high).
- Bollinger Bands: Price is pressed against the lower band with the band itself flattening slightly — a possible early volatility contraction signal after the prior expansion, often a precursor to a short-term bounce.
2. Price Action & Candlestick Patterns
- Daily chart: The move from the ~$92 high into the ~$78 close prints as an evening-star-like sequence — a strong green breakout candle, a smaller-bodied indecision candle at the top, followed by sustained red follow-through. This is a classic exhaustion signature at a new high.
- Weekly chart: The most recent weekly candle is a red candle with a long upper wick relative to the prior green bodies — a rejection wick from the $88 high, suggesting sellers are capping further upside for now without structurally breaking the uptrend.
- 4H chart: The double-top at ~$88 (Sept 4 & Sept 6–7) is the dominant chart pattern — two nearly equal highs separated by a shallow pullback, followed by a decisive break of the neckline (~$83), which is the technical trigger that produced the current down-channel.
- 1H chart: The bounce from the Sept 10–11 low to the Sept 12 high formed a strong bullish engulfing/marabozu candle (the tall green candle breaking out of the lower band), but it failed to hold and reversed — a failed breakout, which now leaves a potential double-bottom structure forming between the Sept 11 low and the current retest near $77.90.
3. RSI Momentum & Divergence Analysis
- Weekly RSI (72.45): Firmly in overbought territory (>70) for a second distinct push (first in Feb–March, now again in Aug–Sep). Sustained overbought readings during strong trends are typically bullish continuation signals, not automatic sell signals — but the reading leaves little room for further upside without a cooling-off period.
- Daily RSI (50.84): Has fallen sharply from an overbought extreme (>75 in early September) back to the 50 midline. This is a healthy, trend-consistent pullback in momentum terms — as long as 50 holds as support on the next bounce attempt, the daily uptrend structure remains intact. A clean break and daily close below 40–45 would be the first real momentum warning sign.
- 4H RSI (32.65): Approaching oversold (<30). Comparing the RSI peaks: the RSI made a lower high between the Sept 4 peak and the Sept 6–7 peak even as price made a marginal higher high on the second push — this is regular bearish divergence, and it’s precisely what preceded the current down-channel. This divergence has already played out and is now largely priced in.
- 1H RSI (27.52): In oversold territory. Comparing the Sept 10–11 low (RSI dipped toward ~20) to the current retest of similar price levels with RSI at 27.5 (a higher low on RSI vs. an equal/marginally lower low on price) — this is an early hidden/regular bullish divergence forming on the lowest timeframe, worth watching for confirmation on the next 1–2 candles.
- Midline Confluence: The Daily RSI sitting almost exactly on the 50 line is the single most important momentum tell on the board right now — it’s the fulcrum between “healthy pullback” and “trend change.”
4. Technical Confluence Synthesis
Several independent signals are converging in the $77.30 – $78.20 zone right now:
- Daily lower Bollinger Band (78.18) and 4H lower Bollinger Band (77.35) are almost stacked on top of each other.
- 1H price action is retesting its own prior swing low (~$77.86) exactly at this same band cluster.
- 1H RSI is showing early bullish divergence at this retest.
- This zone also lines up with the daily horizontal support shelf from the early-September breakout base, and independent market commentary flags $78–79 and $78.98 as the key near-term support band to defend (see sources below).
- On the topside, the 4H/daily resistance at $86–88 aligns with the weekly upper Bollinger Band and the prior all-time-high shelf, making it the key zone bulls need to reclaim for trend continuation.
Reading: This is a high-probability decision zone. A clean hold and reversal candle at $77–78 on the 1H/4H, combined with the Daily RSI defending the 50 midline, would offer a well-confluenced long entry back into the dominant weekly/daily uptrend. A decisive break and 4H close below $77 would invalidate this and open the door to a deeper daily correction toward $73–75.
5. Sentiment Score
🎯 Sentiment Gauge: Neutral-to-Bullish (Cautious)
HYPE has been one of the strongest-performing large-cap crypto assets of the past month, but sentiment has cooled from euphoric to watchful after the early-September blow-off top and pullback.
Key Catalysts:
- HYPE printed a fresh all-time high near $89–92 in early September before correcting, putting the token firmly in “price discovery” territory with few historical resistance references above the highs.
- Hyperliquid’s protocol burned roughly 15,350 HYPE tokens (about $1.32 million) over a 24-hour period through the deflationary Assistance Fund mechanism — an ongoing supply-side tailwind.
- Open interest surged back to roughly $14.3 billion, approaching levels last seen before a sharp 56% crash in October 2025 — a reminder that elevated leverage cuts both ways.
- A scheduled HYPE token unlock (~9.92M tokens) around September 6 has been flagged by analysts as a potential source of near-term selling pressure.
- Broader narrative remains supportive of Hyperliquid’s positioning as a leading on-chain perpetuals/derivatives venue, with continued interest in potential US market expansion cited in recent coverage.
Crowd Sentiment: Retail and analyst commentary flipped from aggressively bullish (targets of $95–$100+) at the early-September peak to more cautious “defend support” framing as price corrected roughly 10–15% off the highs. Elevated open interest alongside the pullback suggests leveraged long positioning is being tested, which raises liquidation risk on both sides of the current range.
🟢 Bullish Drivers:
- Dominant weekly/daily uptrend structure remains fully intact (Higher Highs/Higher Lows since February)
- Ongoing token-burn/deflationary mechanism reducing circulating supply
- Price still trading above major daily/weekly moving averages
- Sector-leading relative performance vs. ETH, SOL, and BTC over the trailing month per crypto trading data
🔴 Bearish Drivers:
- Confirmed 4H double-top with bearish RSI divergence already triggered a corrective leg
- Elevated open interest near pre-crash (Oct 2025) levels raises leverage/liquidation risk
- Recent token unlock adds near-term sell-side supply
- Weekly RSI still overbought, limiting near-term upside room without a deeper reset
6. Final Actionable Trading Ideas
⚠️ Educational analysis only — not financial advice. Crypto markets are highly volatile; leverage and position sizing decisions are the trader’s own responsibility.
Idea 1 — Swing Long: “Buy the Confluence Zone”
- Direction: Long (Buy)
- Strategic Rationale: The dominant weekly/daily trend remains bullish, and the current 4H/1H sell-off is landing directly on a stacked support confluence (daily + 4H lower Bollinger Bands, prior 1H swing low, and daily horizontal shelf) while the 1H RSI shows early bullish divergence. This favors a trend-continuation long rather than chasing the pullback lower.
- Execution Triggers: Wait for a 1H candle close back above $79.30–79.50 (reclaiming the 1H Bollinger Band basis line) alongside a 4H candle that closes green off the $77–78 zone, confirming the reversal rather than trying to catch the falling knife.
- Risk Management:
- Stop Loss: Below $76.80 (below the 1H/4H support cluster and the recent swing low) — a clean break here invalidates the near-term bullish structure.
- Take Profit T1: $82.80–83.00 (4H swing high / prior neckline resistance)
- Take Profit T2: $87–88 (daily/weekly prior high and upper Bollinger Band zone)
Idea 2 — Day Trade / Scalp: “Fade the Failed Breakdown”
- Direction: Long (Buy), intraday scalp
- Strategic Rationale: The 1H chart shows price retesting its own prior low with a higher RSI reading (hidden/regular bullish divergence), while the 1H Bollinger Bands show early signs of contraction after an extended squeeze — often a precursor to a short-covering bounce.
- Execution Triggers: Enter on a 1H bullish reversal candle (hammer/engulfing) forming at or just above $77.80–78.00, ideally with RSI curling back up through 30.
- Risk Management:
- Stop Loss: Tight, below $77.30 (below the 4H lower band and the low of the setup candle)
- Take Profit T1: $79.30–79.50 (1H basis line / initial resistance)
- Take Profit T2: $80.80–81.00 (1H upper Bollinger Band / 4H broken-support resistance)
Frequently Asked Questions:
1. Is HYPE/USD bullish or bearish right now?
It’s mixed by timeframe — the Weekly and Daily trends remain bullish, while the 4H and 1H are in a bearish, corrective phase.
2. What is the most important support level for HYPE right now?
The $77–78 zone is the key support, since it’s where the Daily and 4H lower Bollinger Bands, a prior 1H swing low, and a daily horizontal shelf all converge.
3. What is the next major resistance level for HYPE?
The $86–88 zone is the key resistance, marking the prior all-time-high shelf and the weekly upper Bollinger Band.
4. Is HYPE overbought or oversold on the charts?
The Weekly RSI is overbought at 72.45, while the 4H (32.65) and 1H (27.52) RSIs are near oversold, reflecting the short-term pullback against the longer-term trend.
5. Is there a bearish RSI divergence on any HYPE timeframe?
Yes — the 4H chart shows regular bearish divergence between its two early-September peaks, which preceded the current down-channel.
6. Is there a bullish RSI divergence forming on HYPE?
Yes — the 1H chart shows an early bullish divergence, with RSI printing a higher low while price retests a similar or slightly lower price low.
7. What chart pattern formed on the 4H HYPE chart?
A double top formed near $88 in early September, and its neckline break triggered the current descending channel.
8. Is HYPE’s long-term (Weekly) uptrend still intact?
Yes — the Weekly chart still shows an unbroken series of Higher Highs and Higher Lows dating back to February.
9. What would invalidate the bullish HYPE trading setup?
A decisive 4H candle close below roughly $77 would invalidate the near-term bullish setup and open the door to a deeper correction toward $73–75.
10. What are the take-profit targets for the swing long trade idea?
The first target is $82.80–83.00 (prior 4H swing high/neckline) and the second target is $87–88 (prior daily/weekly high and upper Bollinger Band).
Sources & Further Reading
- Hyperliquid (HYPE) Latest News & Market Update — CoinMarketCap
- Hyperliquid Price Prediction September 2026 — CoinEdition
- Hyperliquid (HYPE) Price Prediction for September 2026 — Bitrue
- Hyperliquid Price Prediction: Can HYPE Reach $100? — StealthEX
- Hyperliquid Price Prediction September 2026 — CoinGabbar
- Hyperliquid (HYPE) Live Price & Market Data — Coinbase
Charts sourced from TradingView (Coinbase HYPE/USD feed), captured September 13, 2026. Analysis reflects price action as of that date and should be re-evaluated as new candles close.
Disclaimer: This report is for informational and educational purposes only and does not constitute financial advice. Cryptocurrency markets are highly volatile — always conduct your own research and manage risk accordingly.
Leave a Reply
You must be logged in to post a comment.