

Current Price: ~$335–338 Analysis Date: September 4, 2026 Timeframes Reviewed: Weekly, Daily, 4-Hour, 1-Hour (Bollinger Bands 20,2 + RSI 14)
Alphabet (GOOG) is consolidating in a $330–$335 multi-timeframe support zone after a sharp correction from its 2026 highs, with early signs of momentum stabilization but no confirmed reversal yet. This report walks through the Weekly-to-1H technical structure, key confluence levels, and two actionable trade setups based on price action, Bollinger Bands, and RSI divergence.
1. Multi-Timeframe Structural Analysis
Weekly (Macro Structure)
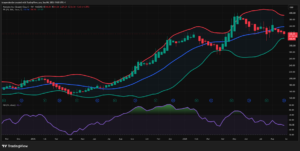
- Market Structure: Powerful primary uptrend from ~$160 (Apr 2025) to a peak near $410–420 (Feb–May 2026), forming a clean sequence of Higher Highs/Higher Lows. Since the May 2026 top, price has printed a Lower High and Lower Low, signaling the first genuine structural crack in an otherwise dominant bull trend — likely the start of a corrective (not necessarily reversal) phase.
- Key Levels: Major support sits in the $322–335 zone (prior consolidation shelf from Feb–Mar 2026 and the current lower Bollinger Band at 322.82). Resistance is layered at $357 (basis/SMA) and the psychological $400 round number where two rejections have occurred.
- Bollinger Bands: Bands are contracting from a wide expansion — the explosive 2025 rally rode the upper band, but the last two candles show price rotating back toward the basis/lower band, indicating volatility is normalizing after an overextended move. Price is currently trading below the 20-week SMA, a first since the rally began.
Daily (Intermediate Structure)
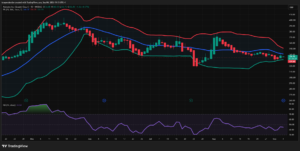
- Market Structure: Descending channel/staircase pattern since the June 2026 high (~$410). Series of Lower Highs (June, July, August) with support repeatedly found near $330–335. This is a classic corrective downtrend within a larger uptrend.
- Key Levels: Support cluster at $330–333 (tested late August, sharp RSI dip to ~30). Resistance at $351 (upper BB/basis convergence) and $365–375 (prior swing highs).
- Bollinger Bands: Bands are squeezing — upper (351) and lower (331) are converging versus the wide August spread, suggesting a volatility contraction that often precedes a directional breakout. Price is currently riding the lower band, a sign of persistent bearish pressure but also a zone where mean-reversion bounces have occurred twice already (late Aug, early Sep).
4-Hour (Swing Structure)
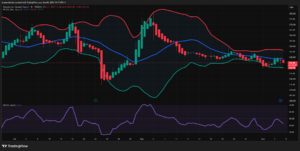
- Market Structure: Clear stair-step downtrend since the early August peak (~$375), each rally attempt capped by a lower high (~355, then ~345). Currently consolidating just above the July low.
- Key Levels: Support at $330–333 (July low / lower BB), resistance at $345–350 (basis + prior breakdown point).
- Bollinger Bands: Bands have narrowed significantly versus the wide July expansion — a squeeze is forming, and price is hugging the lower band (330.62), indicating the intermediate trend remains bearish-biased but momentum is decelerating (candles are getting smaller).
1-Hour (Execution Structure)
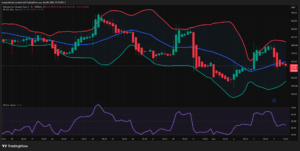
- Market Structure: Choppy, range-bound price action between ~$330 and ~$346 for the past two weeks — a broad trading range rather than a clean trend. A double-top pattern near $339–344 formed between Aug 28 and Sep 3, followed by a sharp breakdown.
- Key Levels: Immediate support at $332–333 (multiple prior reaction lows), resistance at $339–341 (neckline of the recent double top) and $344–346 (range high).
- Bollinger Bands: Price just broke below the basis (341.06) and is drifting toward the lower band (330.46) after rejecting the upper band twice — classic band-walk down the lower half following the double-top breakdown.
2. Price Action & Candlestick Patterns
- 1H – Double Top / Bearish Rejection: Two nearly equal highs (~$339 and ~$344) around Aug 28–Sep 3 with a large bearish breakdown candle through the neckline near $339 — a textbook short-term reversal pattern currently playing out to the downside.
- 1H – Long Upper Wick Rejections: Several candles near the $344–346 zone show extended upper wicks, confirming seller defense at the upper Bollinger Band.
- Daily – Late-August Capitulation Wick: A long lower-wick candle around Aug 23 (RSI ~30) marked a climactic sell-off with immediate buy-side absorption — a hammer-type reversal that produced the subsequent bounce to $365+.
- Daily/4H – Descending Channel: The sequence of lower highs and lower lows since June forms a well-defined down-sloping channel, with price currently near the channel’s lower boundary.
- Weekly – Double Top: The Feb 2026 and Apr/May 2026 highs near $400–410 form a broad double-top/rounding-top structure, reinforcing the case that the primary trend is transitioning from parabolic advance to correction.
3. RSI Momentum & Divergence Analysis
- Weekly: RSI at 48.71, down from overbought (~80) territory reached during both the late-2025 and Apr-2026 rally legs. RSI has now round-tripped back to the midline — no oversold condition yet, meaning there is technically room for further downside before a macro momentum floor is reached. The pattern of RSI making a lower high (second peak ~78 vs. first ~82) while price made a marginally higher high into May 2026 shows early-stage regular bearish divergence.
- Daily: RSI at 44.68, recently spiked to ~63 after the Aug 23 low before rolling over again — a failed bullish momentum thrust, consistent with the ongoing corrective channel. No divergence currently visible against the latest low.
- 4H: RSI at 45.91. Notably, the late-August price low was roughly equal to the September pullback low, but RSI on the Sep low is not diving to a new extreme — an early hint of potential hidden/regular bullish divergence forming if support holds. Needs confirmation.
- 1H: RSI at 45.59, mid-range and trending down with price — no overbought/oversold extremes on this leg down, suggesting the sell-off is not yet exhausted.
- Midline Confluence: Across Daily, 4H, and 1H, the RSI 50 line is acting as resistance on bounce attempts — a classic bearish-regime signature (in downtrends, RSI oscillates between 30–50 rather than 50–70).
4. Technical Confluence Synthesis
Key Confluence Zone: $330–335 (Support)
- Weekly lower Bollinger Band (322.82) and prior swing-low shelf
- Daily lower Bollinger Band (331.12) and the well-tested late-August horizontal support
- 4H lower Bollinger Band (330.62) and July swing low
- 1H immediate support cluster (~$332–333)
- This is the highest-probability support confluence on the chart — four timeframes converging within a ~$5 band.
Key Confluence Zone: $344–351 (Resistance)
- Daily basis/upper band region (341–351)
- 4H basis (338.72) and prior breakdown point (~345–350)
- 1H range high / upper band (346) and double-top neckline
- This zone represents the ceiling that must be reclaimed to invalidate the near-term bearish structure.
Momentum Note: The 4H RSI is showing tentative signs of hidden bullish divergence (equal/higher RSI low vs. equal price low) exactly at the multi-timeframe support band — the single most actionable technical signal on the board, though not yet confirmed on the Daily or Weekly.
Fundamental Overlay: Current price action coincides with a genuine improvement in the news backdrop. After wrapping up its longest monthly losing streak on Wall Street in more than a decade, Google started September with renewed momentum, helped by the launch of Gemini 3.8 Flash and a favorable antitrust ruling. This creates a scenario where oversold technical structure and improving fundamental catalysts could align for a relief rally off the $330–335 support shelf.
5. Sentiment Gauge
Overall Sentiment: Neutral-to-Cautiously Bullish
(short-term stabilization after a heavy technical correction)
Key Catalysts:
- Alphabet fell more than 10% over the past month, significantly underperforming the S&P 500, before starting September on a more positive note.
- Google launched Gemini 3.8 Flash — its third Flash model in six weeks — alongside a new cybersecurity model aimed at government and enterprise customers, and Alphabet’s ad business got a boost from a key antitrust ruling.
- A federal judge rejected the Justice Department’s push to force Google to sell its ad exchange, removing a major overhang on the ad-tech business.
- Q2 2026 results showed a 24.2% revenue increase on a base of almost $120 billion, reinforcing the fundamental growth story despite recent stock weakness.
- Google also rolled out AI voice control features in Gmail, Docs, and Keep, adding to the positive product-news cadence entering September.
Crowd/Institutional Sentiment:
- Berkshire Hathaway has built Alphabet into one of its largest equity holdings, holding nearly 106 million shares worth about $36.6 billion; CEO Greg Abel described Alphabet as a significant AI player and cited this as a reason for authorizing an additional $10 billion of investment.
- Ongoing securities-fraud investigation coverage continues to circulate, though it has not materially dented the stock’s recent stabilization.
- Mixed institutional 13F-style filings (some funds trimming, others like Van Eck initiating new positions) suggest the market is still digesting the correction rather than showing one-sided conviction.
🟢 Bullish Drivers:
- Antitrust overhang materially reduced (ad-tech breakup risk removed)
- Aggressive AI product cadence (Gemini 3.8 Flash) signaling competitive relevance
- Strong Q2 revenue growth (+24%) underpinning fundamentals
- High-profile institutional accumulation (Berkshire Hathaway)
- Technical support confluence at $330–335 across all timeframes
🔴 Bearish Drivers:
- Stock still down double-digits from recent highs; longest losing streak in over a decade just ended
- Weekly/Daily structure remains in a corrective downtrend (lower highs since May/June)
- RSI has not reached oversold on higher timeframes — downside momentum not yet exhausted
- Ongoing securities-fraud litigation headlines create legal/reputational noise
- Valuation concerns persist despite growth
6. Final Actionable Trading Ideas
Idea 1 — Swing Trade: Long from Support Confluence (Mean-Reversion Bounce)
- Direction: Long (Buy)
- Strategic Rationale: Price is arriving at a rare four-timeframe support confluence ($330–335) where Weekly, Daily, and 4H lower Bollinger Bands overlap with prior horizontal structure, while the 4H RSI shows early hidden bullish divergence. Combined with an improved news backdrop (antitrust resolution, AI product launches, institutional accumulation), this zone offers attractive risk/reward for a corrective bounce toward the $351–365 supply zone.
- Execution Triggers: Wait for a Daily or 4H bullish reversal candle (hammer, bullish engulfing) to close within the $330–335 zone, ideally with RSI turning up from sub-50 levels without making a new momentum low.
- Risk Management:
- Stop Loss: Below $322 (Weekly lower Bollinger Band) — a break here invalidates the support confluence and signals trend continuation lower.
- Take Profit T1: $351 (Daily upper Bollinger Band / basis convergence)
- Take Profit T2: $365–375 (prior Daily/4H swing high resistance cluster)
Idea 2 — Day Trade/Scalp: Fade the 1H Double-Top Breakdown (Short Continuation)
- Direction: Short (Sell)
- Strategic Rationale: The 1H chart has confirmed a double-top breakdown below the $339 neckline, with RSI still trending down and not oversold — suggesting near-term downside continuation toward $330–333 is still favored until that zone is actually tested and confirmed to hold.
- Execution Triggers: Enter on a retest-and-rejection of the broken $339 neckline (now resistance) with a bearish 1H candle close back below it, or on a clean break of $333 with rising volume.
- Risk Management:
- Stop Loss: Above $341–342 (1H SMA/basis) — invalidates the breakdown thesis if reclaimed.
- Take Profit T1: $333 (immediate 1H support)
- Take Profit T2: $330 (1H/4H/Daily lower Bollinger Band confluence) — note this target overlaps with Idea 1’s long entry zone, so this short should be closed or flipped rather than held through that level.
References
- stockanalysis.com — GOOGL Overview
- CNBC — Google starts September with AI momentum after longest monthly losing streak in over a decade
- Fool.com — Google Just Won the Right to Keep Its Ad Tech Tools
- Ad Hoc News — Alphabet A Stock Gains Support from Berkshire and AI Model Buzz
- Ad Hoc News — Alphabet A Stock Gains on AI Momentum and Antitrust Win
- GlobeNewswire — Securities Fraud Investigation into Alphabet Inc. (GOOG) Continues
This analysis is based solely on the technical structure visible in the provided TradingView charts and recent publicly reported news. It is not financial advice. Confirm signals with additional volume/order-flow data before executing, and size positions according to your own risk tolerance.
Leave a Reply
You must be logged in to post a comment.