

As of September 01, 2026, 09:55 UTC+1 · Spot: $766.77 (Daily close)
SPY is pulling back from all-time highs near $780 into a key $762–766 support zone, where lower Bollinger Bands, RSI oversold bounces, and prior consolidation levels all converge across timeframes. The broader uptrend remains structurally intact on the Weekly and Daily charts, favoring a buy-the-dip setup unless price decisively breaks below $762.
1. Multi-Timeframe Structural Analysis
Weekly
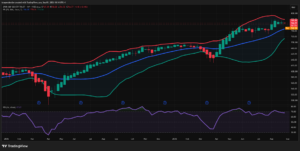
- Structure: Powerful bullish trend intact since the April 2025 low (~$482). Structure is a clean sequence of Higher Highs/Higher Lows, with only two meaningful corrective pauses — the Nov’25–Mar’26 consolidation (~$680–700) and the current post-August pullback from the all-time-high zone near $780.
- Key Levels: Major support sits at the broken resistance-turned-support shelf of ~$745–750 (prior Nov’25 range highs, now roughly aligned with the 20-week basis at $746.20). Deeper structural support lies at $713 (lower band) and the March’26 breakout base ~$680. Resistance is the untested all-time high ~$780.
- Bollinger Bands: Price has been riding the upper band for months (classic strong-trend “walking the band” behavior). The current candle is the first real reversion back toward the basis line — normal and healthy within an uptrend, not yet a breakdown signal.
Daily
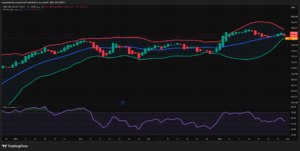
- Structure: Uptrend from the May low ($720) to the mid-August high ($780), now in a corrective pullback/consolidation, printing a mild Lower-High/Lower-Low sequence over the last ~10 sessions.
- Key Levels: Resistance at $777–780 (recent swing high + upper band). Support at $762–764 (lower band + late-Jun/early-Jul consolidation shelf) and psychological $760.
- Bollinger Bands: Bands are contracting after the sharp August expansion — classic post-impulse squeeze. Price has closed back below the basis line ($769.97), signaling the pullback has real short-term teeth, but bands have not flipped into a bearish expansion.
4-Hour
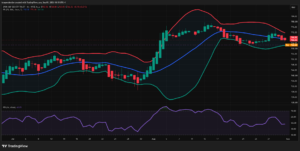
- Structure: After the vertical August rally, price is now range-bound/consolidating between roughly $764 and $773 — a sideways channel following the trend impulse (classic flag-like pause).
- Key Levels: Range resistance ~$772–773 (basis/former breakout zone), range support ~$762 (lower band, tested multiple times).
- Bollinger Bands: Clear squeeze in progress — upper and lower bands have compressed from a ~$56 spread (Aug 5 peak) to under $15 currently.
1-Hour
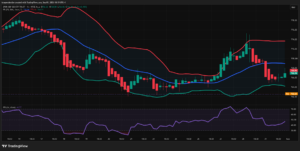
- Structure: Choppy, mean-reverting price action within the broader 4H range. A sharp leg down from $778→$762 (Aug 18–24), a recovery rally to $774 (Aug 27–28), then a fresh impulsive drop to $766 (Aug 31), followed by a small basing/reversal attempt into the current bar.
- Key Levels: Intraday support $764–766 (today’s low + lower band), resistance $769–770 (basis) and $774 (recent swing high).
- Bollinger Bands: Price is hugging/testing the lower band at $764.21, with the most recent 2 candles showing a bounce off the band — an early sign of short-term stabilization.
2. Price Action & Candlestick Patterns
- 1H: The Aug 31 sell-off produced a long-bodied red candle punching through the lower band, followed by two consecutive small-bodied green candles reclaiming the band — a tentative bullish reversal/hammer-like sequence at the band’s lower extreme.
- 4H: The last two 4H candles show small real bodies with long lower wicks near $765 — rejection wicks off range support, consistent with the 1H basing pattern.
- Daily: The pullback from the mid-Aug high shows a series of overlapping red/green candles with shrinking ranges — an inside-bar/coiling pattern, not a decisive breakdown. No clear engulfing or star pattern at the high, just gradual profit-taking.
Chart Pattern (4H/Daily)
- The Aug 5–31 price action forms a textbook bull flag / ascending-to-sideways consolidation after the vertical July–August rally — the measured move implies continuation risk to the upside if resolved bullishly, but a range breakdown targets the $745–750 Weekly support zone.
Weekly
- No classic reversal pattern (no confirmed double top) — simply a large-bodied red weekly candle pulling back from the highs, still within the intact uptrend channel.
3. RSI Momentum & Divergence Analysis
- Weekly RSI (67.6): Elevated but not overbought (>70). No bearish divergence — RSI highs have generally tracked price highs, confirming trend strength.
- Daily RSI (54.1): Neutral, sitting just above the 50 midline after cooling from an overbought reading near 75 in mid-August. This is a healthy reset, not a momentum breakdown.
- 4H RSI (48.0): Sitting just below midline — consistent with the range structure. No strong divergence visible; RSI is oscillating in a 40–65 band mirroring the price range.
- 1H RSI (46.6): Notably, RSI dipped to ~28 (oversold) on the Aug 31 low while price made its low — and the most recent 1H candles show price stabilizing while RSI climbs off oversold, a mild bullish momentum shift on the lowest timeframe, though not yet a classic divergence since price hasn’t yet made a higher low to compare.
- Midline Confluence: Both Daily and 4H RSI are converging right at/near the 50 line — a decision point.
4. Technical Confluence Synthesis
- Bullish Confluence: The 1H oversold RSI bounce + lower Bollinger Band rejection (both 1H and 4H) is occurring inside a still-intact Weekly/Daily uptrend, with price sitting just above the Daily’s key $762–764 support shelf. This mirrors the classic “lower-timeframe pullback within higher-timeframe trend” setup.
- Bearish Confluence: The Daily close below its 20-SMA basis, combined with 4H/Daily RSI pinned under/at 50, and the broader macro backdrop (see Section 5) argue for caution — a decisive break of $762 on Daily closing basis would open the door to the $745–750 Weekly support zone.
- Highest-probability zone: $762–766 is the key confluence band — the Daily/4H lower Bollinger Band, prior consolidation shelf, and the 1H oversold-RSI-bounce origin all cluster here. This is the line in the sand for near-term direction.
5. Sentiment Gauge
Overall Sentiment: 🟡 Neutral-to-Cautious (leaning bullish on trend, bearish on near-term catalysts)
Key Catalysts
- Stocks ended August on a weaker note as oil prices climbed and pushed rates higher following escalating U.S. strikes on Iran-linked targets, dragging the Dow down over 370 points and pulling the S&P 500 and Nasdaq lower on the final trading day of the month. — CNBC, Aug 31, 2026
- Futures are pointing to a modestly positive open as investors weigh the escalating U.S.-Iran military situation alongside an intensifying debate over AI data-center spending. — Benzinga, Sep 1, 2026
- The broader 2026 rally has been underpinned by exceptionally strong corporate earnings, with S&P 500 companies posting their strongest revenue and earnings growth in years, led by AI-infrastructure names among the major tech and communications firms. — The Motley Fool via Yahoo Finance
- Seasonality is a headwind: the S&P 500 has historically declined in the majority of Septembers since 1928, averaging roughly a 1% loss for the month, though it has still risen in a substantial minority of years. — The Motley Fool, Aug 31, 2026
- The index shed a third of one percent on the final day of August but is still holding above the upper limit of the consolidation range it broke out from at the start of the month. — Equity Clock, Aug 31, 2026
Crowd Sentiment
- Prediction-market positioning (Polymarket) currently shows a moderately bullish lean for today’s session, with around a 56% probability assigned to a higher open. — Benzinga
- Technical commentary notes the index is still holding above the upper boundary of its prior multi-month consolidation range, suggesting the broader breakout structure hasn’t been invalidated despite the recent pullback. — Equity Clock
🟢 Bullish Drivers
- Powerful, uninterrupted YTD uptrend backed by strong Q2 earnings growth
- AI infrastructure spending narrative still supportive of mega-cap leadership
- Weekly/Daily structure remains a Higher-High/Higher-Low uptrend
- 1H oversold bounce + lower-band rejection suggests near-term stabilization
🔴 Bearish Drivers
- Escalating U.S.-Iran military conflict pushing oil and rates higher
- Historically weak September seasonality (down in 56% of years since 1928)
- Daily/4H RSI stuck at/below the 50 midline — momentum has cooled
- Elevated valuations (forward P/E near cycle highs) leave less room for error
- Debate intensifying around sustainability of AI capex spending
6. Final Actionable Trading Ideas
Idea 1 — Swing Long (Buy-the-Dip within Uptrend)
- Direction: Long
- Strategic Rationale: The pullback from $780 to the $762–766 confluence zone represents a retracement into major Weekly/Daily support and the lower Bollinger Band, occurring within an intact, earnings-driven bull trend. The 1H RSI has already reset from oversold, hinting the near-term selling pressure is fading.
- Execution Triggers: Wait for a 4H candle close back above the 4H basis (~$767–768), confirming the range low has held, or a Daily close reclaiming $769.97 (Daily 20-SMA).
- Risk Management:
- Stop Loss: Below $761.50 (under the Daily lower Bollinger Band and the recent multi-test range low) — a break here invalidates the “support hold” thesis.
- T1: $774 (recent 4H/1H swing high, prior range resistance)
- T2: $780 (Weekly/Daily all-time-high zone, upper Bollinger Band)
Idea 2 — Range/Scalp Short (Failure at Resistance)
- Direction: Short (tactical, countertrend)
- Strategic Rationale: Given the macro overhang (Iran-driven oil spike, weak September seasonality, cooling RSI at midline), a failed retest of the 4H range resistance offers a lower-risk short scalp back toward range support, provided price fails to reclaim the Daily basis.
- Execution Triggers: Look for a bearish rejection candle (pin bar/engulfing) on the 1H or 4H at $772–774, ideally with RSI failing to clear 55–60 on the 4H.
- Risk Management:
- Stop Loss: Above $775 (beyond the recent 4H swing high) — a clean break here signals the squeeze resolved bullishly, negating the short.
- T1: $766 (basing zone / prior 1H support)
- T2: $762 (Daily/4H lower Bollinger Band, range floor)
Disclaimer: This analysis is for educational/informational purposes only and is not personalized financial advice. Position sizing and stop placement should reflect individual risk tolerance. The tight 4H Bollinger Band squeeze means volatility — and the potential for a sharp directional move — could increase quickly in either direction.
Leave a Reply
You must be logged in to post a comment.