

Date: August 31, 2026, 10:35 UTC+1 Spot Gold Price: ~$4,440 Timeframes Reviewed: Weekly · Daily · 4-Hour · 1-Hour Indicators: Bollinger Bands (20, 2 SD) · RSI (14)
Gold (XAU/USD) is consolidating in a corrective pullback after a sharp rally, with price testing key support near $4,395–4,440 where oversold 4H/1H RSI readings, the lower Bollinger Band, and the Daily SMA20 all converge. The higher-timeframe uptrend remains intact, favoring a buy-the-dip approach on confirmation, while a break below $4,390 would open the door to $4,300–4,150.
1. Multi-Timeframe Structural Analysis
Weekly
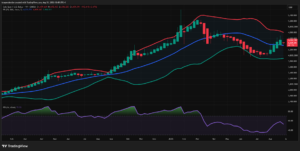
- Structure: Powerful primary uptrend from ~$2,800 (Feb 2025) to a blow-off top near $5,600 (Jan/Feb 2026), followed by a sharp corrective impulse down to ~$4,150–4,200. Price is now basing/recovering — a classic post-parabolic mean-reversion phase, not yet a confirmed new downtrend (no clear lower low sequence below $4,150 yet).
- Key Levels: Major resistance at the psychological $5,000 level and the prior swing high ~$5,400–5,600. Key support/demand zone $4,150–4,200 (multiple weekly closes), with $4,000 as the round-number backstop. Current price ($4,439) sits mid-range between these.
- Bollinger Bands: Still wide from the parabolic move but contracting as price consolidates between the mid-band (SMA20, ~$4,800) and lower band (~$3,900). Price trades well below the 20-week SMA — the dominant uptrend character has faded into a range/repair phase.
Daily
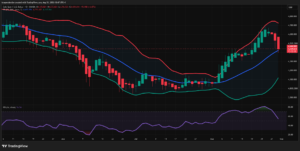
- Structure: After topping near $4,700 (May) the market carved a down-leg into $4,150 (Jun–Jul lows), based sideways for several weeks, then produced a clean Higher-Low/Higher-High sequence since early August — the most bullish structure on the board — up to a swing high near $4,660 (Aug 24), followed by a 3–4 day pullback to $4,440.
- Key Levels: Support at $4,300–4,350 (breakout base) and $4,150 (major low); resistance at $4,650–4,700 (August/May highs).
- Bollinger Bands: Clear expansion during the Aug 6–24 rally (price riding the upper band), now contracting again with price pulling back toward the middle band (SMA20 ≈ $4,422) — a normal “re-test the mean after expansion” pattern rather than a trend failure.
4-Hour
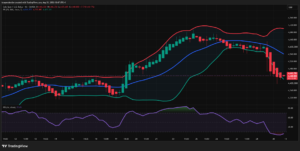
- Structure: Sharp impulsive rally Aug 19–25 (~$4,380 → ~$4,670), followed by a rejection at the upper band and a steep, near-uninterrupted decline into Aug 29–30 lows of $4,396.
- Key Levels: Support at $4,395–4,420 (current test zone); resistance at $4,600 (broken SMA20) and $4,660–4,670 (swing high).
- Bollinger Bands: Textbook expansion-then-reversal — bands flared out on the rally, price is now riding/pressing the lower band, and the bands are widening again to the downside, showing real momentum behind the correction.
1-Hour
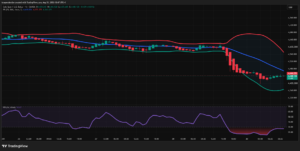
- Structure: Range/consolidation ($4,600–4,650) Aug 26–28, followed by a decisive breakdown starting Aug 28 15:00 that accelerated into Aug 29, then stabilization over the last ~12 hours around $4,435–4,445.
- Key Levels: Immediate support/resistance flip zone at $4,440–4,460 (former breakdown shelf, now being tested from below); resistance at $4,560–4,600 (broken trendline/SMA20).
- Bollinger Bands: Expanded violently during the sell-off (price riding the lower band for multiple candles = strong momentum), now flattening/contracting as price prints small-bodied candles near the lower/mid-band — an early signature of exhaustion and squeeze.
2. Price Action & Candlestick Patterns
- Weekly: Most recent candle is bearish (−2.48%) but closed off its lows and remains inside the prior week’s range — continuation of choppy consolidation, not a decisive breakdown.
- Daily: Aug 24–26 shows a run of small-bodied/indecision candles (spinning tops) right at the upper Bollinger Band near $4,650 — a classic exhaustion signature ahead of the reversal. Subsequent red candles are trending but haven’t yet produced a reversal signal (no bullish engulfing/hammer at support).
- 4H: Candles into the Aug 25 top show overlapping small bodies with long wicks at the band top (indecision/distribution). The move down (Aug 28–29) is large-bodied red candles with minimal wicks — strong seller control, not yet climactic. The most recent 2–3 candles show smaller ranges and a slight green candle — tentative stabilization, unconfirmed.
- 1H: The breakdown leg (Aug 28–29) is a series of long, marubozu-style red candles — a momentum thrust. The last 6–8 hours show a tight, low-range consolidation just above $4,440 — a possible bull-flag/basing structure requiring a trigger candle (bullish engulfing or higher-low breakout) for confirmation.
- Chart patterns: Daily/4H combination resembles an ascending channel (Aug 6–24) that broke to the downside; the pullback is testing the lower boundary of that broken channel, aligning with the daily SMA20. No double top/H&S confirmed yet — this reads as a corrective pullback within a still-intact medium-term uptrend.
3. RSI Momentum & Divergence Analysis
| Timeframe | RSI Level | Reading |
|---|---|---|
| Weekly | 52.91 | Neutral, recovering from a mid-40s low (Jun/Jul) — momentum repairing but not yet trending |
| Daily | 54.49 | Rolled over from overbought (>70 around Aug 24) — classic overbought unwind |
| 4H | 25.58 | Oversold |
| 1H | 26.63 | Oversold, curling flat/up over the last few candles |
- Regular Bearish Divergence (Daily): Price made a marginally higher high into Aug 24 while RSI failed to reach a correspondingly extreme high vs. the earlier autumn move — consistent with the momentum fade that preceded the pullback.
- Potential Bullish Divergence forming (4H/1H): Into the Aug 29–30 lows, the 1H RSI shows early signs of higher lows while price makes equal/marginal new lows — a nascent hidden/regular bullish divergence that needs one more confirmed swing to validate.
- Midline Confluence: Weekly and Daily RSI both hover around the 50 midline — a historically important pivot in this dataset (RSI bounced from ~40 in Jun/Jul and rejected near 80 in Nov/Dec/Feb). A hold above 50 on the daily favors bulls regaining control; a rejection back below 45 favors further downside.
4. Technical Confluence Synthesis
- Bullish confluence zone: $4,395–4,440. This is where (a) 4H/1H oversold RSI readings sit, (b) 4H/1H price is testing/riding the lower Bollinger Band, (c) the Daily SMA20 (~$4,422) is being retested after the August rally, and (d) it aligns with the broken ascending channel’s lower boundary. This is the highest-quality “buy the dip” zone on the board if a reversal candle confirms.
- Bearish confluence risk: If $4,395 (recent 4H/1H swing low) breaks with conviction, the next real structural support isn’t until the Daily/Weekly $4,300 → $4,150 zone, and Weekly RSI could roll back toward 40–45, reopening the broader corrective structure.
- Net read: Higher timeframes (Weekly/Daily) remain in a constructive, base-building uptrend context; lower timeframes (4H/1H) just completed a sharp, momentum-driven corrective leg that is now oversold at a well-defined support shelf. This is a “buy-the-dip-in-an-uptrend-context, but wait for confirmation” setup rather than a clean trend-reversal setup.
5. Sentiment Gauge & Catalysts
Sentiment Gauge: Neutral-to-Cautiously-Bullish (short-term bearish pressure from rate-path repricing, but medium-term uptrend intact)
Key Catalysts:
- Gold has pulled back toward $4,445 as a hawkish speech from Fed Chair Kevin Warsh raised expectations for a September rate hike — the direct driver of the recent decline (higher expected rates increase the opportunity cost of holding non-yielding gold).
- The US dollar index rallied to a one-week high on hawkish Fed commentary suggesting inflation isn’t meaningfully slowing, adding further headwind pressure on gold.
- Middle East tensions remain an offsetting safe-haven/bullish factor competing against dollar strength, contributing to the choppy, two-sided price action on lower timeframes.
- This week’s macro calendar includes August manufacturing/services PMI data, July JOLTS job openings, and August ADP nonfarm employment data — all likely to drive short-term volatility and confirm or invalidate the current oversold bounce setup.
- Despite the pullback, gold’s recent 24-hour range spanned roughly $4,491–$4,642, and the broader 2025–2026 move remains one of the largest bull runs in gold’s history — dip-buying instincts likely remain strong among longer-term holders.
Crowd/Positioning Note: The speed and magnitude of the 4H/1H sell-off (large marubozu candles, RSI plunging into the mid-20s) is consistent with leveraged long liquidation/stop-runs following the Warsh rate repricing, rather than fresh conviction-driven short positioning — a setup that often mean-reverts sharply once the flush completes.
6. Final Actionable Trading Ideas
Idea 1 — Swing/Day Trade: Long (Buy the Dip) — Primary Idea
Direction: Long
Strategic Rationale: The Daily/Weekly structure remains constructively bullish (higher-low sequence since the June/July lows), while the 4H/1H sell-off has pushed RSI into oversold territory exactly at the Daily SMA20 and the lower Bollinger Band — a classic pullback-into-support setup within a still-intact uptrend, not a broken trend.
Execution Triggers:
- Wait for a 1H or 4H bullish reversal candle (bullish engulfing, hammer, or morning star) to close back inside the lower Bollinger Band, ideally with RSI crossing back above 30.
- Confirmation upgrade: a 1H candle close back above $4,460 (reclaiming the recent breakdown shelf) adds conviction.
Risk Management:
- Stop Loss: Below $4,390 (below the recent 4H/1H swing low and the weekly-relevant $4,395 shelf) — a break here invalidates the “support hold” thesis and opens the door to the $4,300 zone.
- T1: $4,560–4,600 (Daily SMA20 / broken 4H structure / prior consolidation shelf).
- T2: $4,650–4,670 (August daily/4H swing high, and the upper Daily Bollinger Band).
Idea 2 — Scalp/Short-Term Fade: Short (Counter-Trend, Lower Timeframe Only)
Direction: Short (tactical, small size, only if Idea 1’s support fails)
Strategic Rationale: If the $4,395–4,440 confluence zone fails to hold and the Daily RSI rolls back below 50, the daily bearish divergence off the Aug 24 high would be “confirmed,” and the market would likely accelerate toward the next major support band.
Execution Triggers:
- Wait for a decisive 1H/4H candle close below $4,395 with RSI making a fresh low below 25 (momentum confirmation of breakdown, not just a wick).
Risk Management:
- Stop Loss: Above $4,460 (back inside the reclaimed range — invalidates breakdown).
- T1: $4,300 (Daily consolidation base).
- T2: $4,150–4,200 (major Weekly support / prior basing zone).
Bottom Line
The dominant technical picture is a healthy, oversold pullback (4H/1H) inside a still-intact medium-term uptrend (Daily/Weekly), with the $4,395–4,440 zone as the pivotal battleground. A confirmed reversal candle there favors longs toward $4,600+; a clean break below $4,390 shifts the bias toward $4,300–4,150.
This analysis is for informational and educational purposes only and does not constitute personalized financial advice. Always size positions according to your own risk tolerance and confirm signals with your own due diligence before trading.
Leave a Reply
You must be logged in to post a comment.