

Data as of Aug 31, 2026, 11:15 UTC+1
Silver (XAG/USD) is consolidating just above key support near $65.50–$66.00 after a sharp reversal from the $70–71 resistance zone, with higher-timeframe momentum still constructive but lower-timeframe RSI showing early signs of stabilizing. This multi-timeframe analysis identifies the highest-probability support and resistance confluence zones, along with two concrete long trade setups with defined entry triggers, stop-loss levels, and profit targets.
1. Multi-Timeframe Structural Analysis
Weekly
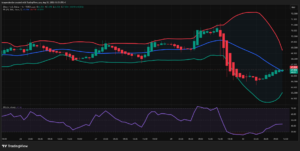
- Structure: Massive multi-quarter bull run from ~$30 (early 2025) to a blow-off top near $98–100 (Oct 2025–Feb 2026), followed by a deep corrective decline into a low near $55–57 (Jun 2026). Price has since staged a recovery, printing three consecutive weeks of Higher Lows back toward $67.
- Key levels: The $66–67 zone (current price) is a well-tested pivot — it capped price action multiple times during the 2025 ascent and now sits almost exactly on the weekly SMA basis (~67.48). Above, the $71–72 zone is the next real resistance (2026 consolidation shelf); below, $60 and then the $55–57 low mark major support.
- Bollinger Bands: The bands are still very wide (upper 81.9 / lower 53.0) — a residual imprint of the 2025 volatility spike — but price sits back inside the “middle third” of the range, meaning the weekly band width is not yet a useful short-term signal. The key tell is price closing essentially on the basis line, a classic equilibrium/decision point after a strong recovery leg.
Daily
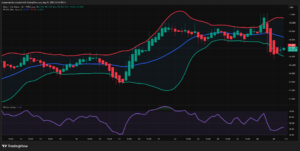
- Structure: Clear downtrend May→late June (85→55), a clean base, then a strong recovery trend June–August (55→71). The most recent daily candle is a large bearish reversal candle that erased ~5 days of gains in one session, closing back at the daily SMA basis (~65.5–66).
- Key levels: $71–72 is now confirmed daily resistance (double top-ish structure: the failed push there in Aug). $65.5 (basis) is immediate support; $60 (prior base high) is the next shelf below that.
- Bollinger Bands: Bands had begun to expand cleanly during the uptrend (price riding the upper band June 22–Aug 26), classic trend-riding behavior. The reversal candle sliced back through the upper band and basis in one move — a volatility-expansion event to the downside, signaling the uptrend’s momentum phase is over, at least temporarily.
4-Hour
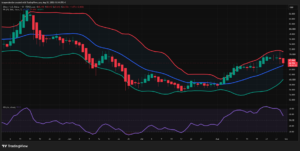
- Structure: Uptrend from ~65 (Aug 20) to a spike high ~71 (Aug 23), then choppy consolidation 68–69.5 for several days, followed by a violent breakdown (Aug 29–30) that sliced through the basis and lower band in two large red candles. Price is now attempting to base just above/at the lower band (~66.0).
- Key levels: $69–70 (recent range highs) is resistance; $66.0 (lower BB) and $65.0 psychological level are the immediate support shelf.
- Bollinger Bands: Sharp expansion during the selloff (bands flared out from ~68.3–70.6 to a much wider spread), now beginning to contract slightly as price stabilizes — an early squeeze/consolidation signature after a volatility shock.
1-Hour
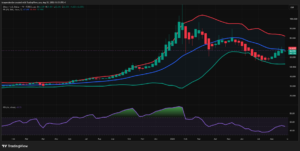
- Structure: Same late-Aug uptrend/spike/breakdown sequence in finer detail. After undercutting the lower band near 65.0, price has printed a series of small-bodied green candles climbing back to the 1H basis (~66.9), essentially the current price.
- Key levels: $66.9 (basis, current test) is the immediate pivot; a reclaim opens $67.5–68.0 (prior broken support turned resistance); failure sends price back to retest $65.0–65.5.
- Bollinger Bands: Bands are still historically wide from the breakdown but the recent candles are compressing back toward the basis — the “throwback” rally common after a sharp impulsive drop.
2. Price Action & Candlestick Patterns
- Daily: The candle that dropped from ~$70 to $66.5 is a large bearish engulfing/marubozu-style candle following an extended run at the upper Bollinger Band — a textbook exhaustion signal after a multi-week rally.
- 4H: Two consecutive large bearish candles (Aug 29–30) broke below both the basis and lower band — a bearish “band walk” reversal. The candles since have small real bodies with long lower wicks near $66.0, suggesting seller absorption / early basing (potential Hammer-family price action, though not a textbook single-candle pin bar).
- 1H: A clear capitulation move undercutting the lower band, followed by a string of small green-bodied candles grinding higher — resembles a mini “rounding bottom” / accumulation structure rather than a single reversal candle.
- Chart pattern context: On the Daily/4H, the Aug 20–28 rally followed by the sharp reversal traces out a spike-and-reversal (blow-off) pattern at the $70–71 resistance shelf — not a full double top yet, but the zone should now be respected as supply until proven otherwise.
3. RSI Momentum & Divergence Analysis
- Weekly RSI: 49.7 — sitting almost exactly on the 50 midline after recovering from deeply oversold conditions during the 2026 correction. The prior weekly RSI shows two overbought excursions (>70) during the 2025 rally with the second push into new price highs showing a comparably stretched-but-not-higher RSI reading — consistent with the regular bearish divergence that historically preceded the large 2025–2026 correction. Currently, the midline reclaim attempt is the key tell to watch: a clean hold above 50 would support the case that the broader downtrend has bottomed.
- Daily RSI: 57.7 — pulled back sharply from overbought (~75) territory at the recent price high but remains above the 50 midline, meaning momentum has cooled without yet flipping bearish. This is normal profit-taking after a strong impulsive leg, not (yet) a structural trend change.
- 4H RSI: 43.1 — dropped from ~70 to the low-40s during the breakdown, now attempting to stabilize below the midline. Watch for a reclaim of 50 as confirmation of a genuine bounce rather than a dead-cat rally.
- 1H RSI: 43.1, having spiked down toward oversold (~30) during the capitulation candles and is now recovering. Price made its lowest print alongside the RSI trough; the subsequent higher-low sequence in price while RSI holds above its prior trough is a tentative hidden/regular bullish divergence on the lowest timeframe — useful for a scalp thesis but not yet confirmed on a closing basis.
4. Technical Confluence Synthesis
- Bullish confluence zone: $65.5–66.0 — this is simultaneously the Daily SMA basis, the 4H lower Bollinger Band, the 1H capitulation low, and sits just below the Weekly pivot. A defended low here, combined with 1H bullish divergence and 4H RSI reclaiming 50, would be a high-probability dip-buy zone for a bounce back toward $69–71.
- Bearish confluence zone: $70–72 — Weekly and Daily resistance shelf, the level of the recent blow-off top and reversal candle, and the origin of the current selloff. Rejection here across 4H/1H would reinforce the “failed breakout” narrative.
- Net read: Higher timeframes (Weekly/Daily) are in a constructive-but-cooling posture (RSI > 50, structure still higher-lows), while lower timeframes (4H/1H) just experienced a violent momentum flush and are now testing whether $66 support holds. This is a classic “higher-timeframe uptrend, lower-timeframe pullback” setup — the market is deciding whether this is healthy consolidation or the start of a deeper correction.
5. Sentiment Gauge & Key Catalysts
Sentiment Gauge: Neutral-to-Cautiously Bullish (short-term shaken)
- Catalysts: Silver’s 2026 rally has been driven by inflation concerns, Fed rate-decision uncertainty, and geopolitical risk premiums, but the market has just been jolted by a hotter-than-expected US inflation print that raised the odds of a Fed rate hike before year-end, alongside Fed Chair Kevin Warsh’s Jackson Hole remarks — markets are pricing roughly a 65% chance rates stay unchanged in September, while the probability of a hike by December has climbed above 70%. Higher-rate expectations are a direct headwind for a non-yielding asset like silver, which explains the sharp reversal from the ~$70–71 highs.
- Supply/demand backdrop: Speculative positioning has reportedly washed out to roughly the 20th percentile of the past 60 weeks, suggesting much of the “hot money” length has already been flushed — often a precondition for a more durable low. On the demand side, J.P. Morgan Global Research has flagged softening import demand from India and China, and noted solar-panel makers are adopting silver-thrifting technology, a medium-term headwind for physical demand even as investment demand stays elevated.
- Institutional outlook: J.P. Morgan’s Global Research forecasts silver averaging around $70/oz for 2026 before easing toward $63/oz in 2027 as rate hikes and unwinding physical tightness weigh on prices — a moderately bearish medium-term institutional view relative to spot. Other desks (BlackRock, J.P. Morgan retail-facing commentary) had earlier flagged a path toward $80/oz by year-end 2026, illustrating a genuine split in institutional views between the momentum bulls and the rate-sensitive bears.
- Retail/crowd tone: Coverage through most of August emphasized silver’s outsized year-over-year gains (commentary repeatedly cites silver up around 72% versus a year earlier), which had fueled retail momentum-chasing into the $70 level — the reversal since Aug 28 looks like a classic unwind of that late-cycle enthusiasm rather than a change in the primary macro narrative.
6. Final Actionable Trading Ideas
Idea 1 — Swing Long (Higher-Timeframe Dip Buy)
- Direction: Long
- Rationale: Weekly/Daily structure remains constructively higher-lows with RSI holding above/near the 50 midline, while the current pullback is landing on a well-defined multi-timeframe support confluence ($65.5–66.0). This favors treating the recent selloff as a correction within an intermediate uptrend rather than a trend change, provided support holds.
- Execution trigger: Wait for a Daily candle close back above the Daily basis (~66.0–66.5) with 4H RSI reclaiming 50, confirming the dip is being bought rather than extending.
- Invalidation/Stop: Below $65.0 (below the 1H capitulation low and psychological round number) — a break here would negate the support confluence and open the door to a retest of $60.
- Targets: T1 = $69.0–69.5 (recent 4H consolidation shelf); T2 = $71–72 (Weekly/Daily resistance and the origin of the reversal candle).
Idea 2 — Intraday/Scalp Long (Lower-Timeframe Reversal Play)
- Direction: Long
- Rationale: The 1H chart shows a completed capitulation flush with early signs of bullish divergence (price low vs. RSI trough), and price is currently pressing against the 1H basis after a grinding recovery — a momentum-confirmation entry here targets a retest of the broken 4H range.
- Execution trigger: A 1H candle close above the 1H Bollinger basis (~66.9) accompanied by RSI pushing through 50, ideally with the 4H also showing basing candles rather than fresh lower lows.
- Invalidation/Stop: Below $66.0 (4H lower band / recent 1H swing low) — a clean break here signals the bounce has failed.
- Targets: T1 = $67.5–68.0 (prior broken 4H support, now first resistance); T2 = $69.0 (4H mid-range/prior consolidation shelf).
Risk note: This is a technical read, not investment advice — position sizing should account for silver’s elevated realized volatility this month, and the macro catalyst calendar (Fed commentary, inflation data) can override technical levels intraday.
Leave a Reply
You must be logged in to post a comment.