

As of September 2, 2026 — Price: $707.51–707.83
QQQ is pulling back from its 2026 highs into a critical multi-timeframe support confluence at $704–$708, where daily, 4-hour, and hourly Bollinger Band lower bands align with early bullish RSI divergence on the 1-hour chart. As long as this zone holds, the broader weekly uptrend remains intact and favors a dip-buy setup; a confirmed break below $704 shifts the bias toward further downside toward $690–$667.
1. Multi-Timeframe Structural Analysis
Weekly
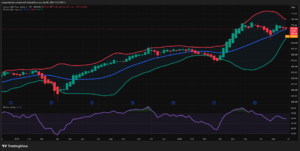
- Structure: Powerful bull trend from the ~$450 tariff-shock low (April 2025) to a swing high near ~$780 (May/June 2026). Since that peak, price has printed three consecutive lower weekly closes — the first meaningful sign of a corrective/consolidation phase within the larger uptrend, not (yet) a structural breakdown, since price still holds well above the basis.
- Key Levels: Major support sits at $667.52 (lower band) and the psychological $700 round number. Resistance is the recent swing high zone $760–$780. The basis (SMA) at $708.15 is being tested right now — a pivotal decision point.
- BB Interaction: Bands expanded hard into the June/July rally, are now contracting slightly as price mean-reverts back toward the basis — classic “cool-off” behavior after a band-ride advance, not a full breakdown.
Daily
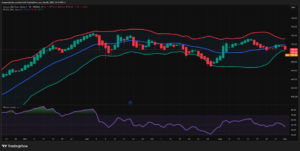
- Structure: Higher-high/higher-low sequence from the April low, but the most recent leg (mid-Aug high ~$730 → current $708) is a clean impulsive pullback. Price is pressing the lower band ($704.11) exactly as it did at the late-July low.
- Key Levels: $704–$708 is now a double-tested demand zone (late-July low + current). Resistance at basis $718.34 and upper band $732.58.
- BB Interaction: Bands are still fairly wide from the June expansion; price riding the lower band suggests either an oversold bounce setup or the start of a deeper band-walk lower if $704 fails.
4-Hour
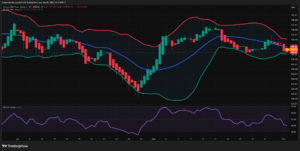
- Structure: Clear short-term downtrend since Aug 28 peak (~$724) — sequence of lower highs and lower lows into today’s $707 print.
- Key Levels: Basis/resistance $712.93, upper band/major resistance $720.83. Support/lower band $705.02 — price is compressing right into it.
- BB Interaction: Bands are narrowing versus the July squeeze/expansion cycle; price hugging the lower band signals trend-continuation pressure to the downside unless a reclaim of the basis occurs.
1-Hour
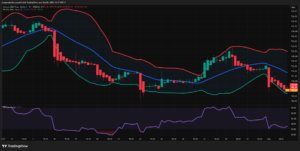
- Structure: Sharp decline Aug 17→21 ($731→$705), a rotational base Aug 21–26, an impulsive rally to $724 (Aug 27–28), then a full retracement back to $707 — essentially round-tripping the entire prior rally in three days.
- Key Levels: Immediate support $704.91 (lower band, also the Aug 24 low), resistance $713–$714 (basis) then $721.92 (upper band).
- BB Interaction: Price is once again pressed against the lower band with the band starting to widen — a volatility-expansion move to the downside, mirroring the Aug 20–21 pattern that preceded a bounce.
2. Price Action & Candlestick Patterns
- 1H: A large bearish marabozu/expansion candle on Aug 24 preceded the swing low near $704 — a classic capitulation candle that immediately reversed. The most recent 1H candles show shrinking red bodies into the lower band, hinting at seller exhaustion similar to Aug 24.
- 4H: The Aug 28→now decline is a fairly clean descending channel — lower highs stacking neatly under the basis line, textbook trend continuation structure rather than a sharp reversal pattern.
- Daily: The late-July low candle was a long lower-wick hammer-type candle right at the lower band, which preceded a strong reversal rally to $730 — the current setup ($708, testing the lower band again) is a structural analogue of that prior low, worth watching for a repeat pattern.
- Weekly: The last two weekly candles are small-bodied red candles closing near their lows — early inside-bar/indecision characteristics sitting right on the basis, not yet a confirmed reversal signal.
- Chart Pattern: Zooming out, the Daily/Weekly structure since June resembles an ascending channel with the current pullback testing the channel’s lower boundary/basis — no double-top or head-and-shoulders is currently confirmed.
3. RSI Momentum & Divergence Analysis
| Timeframe | RSI Now | Zone | Notes |
|---|---|---|---|
| Weekly | 59.0 | Neutral-bullish | Cooling off from two prior overbought (>70) excursions; holding above 50 midline — trend momentum intact but decelerating |
| Daily | 46.2 | Below midline | Down from ~70 (mid-Aug) to below 50 — momentum has flipped short-term bearish |
| 4H | 40.0 | Below midline | Steady decline from ~70 (Aug 17) — no basing yet |
| 1H | 35.7 | Approaching oversold | Recovered from <30 (Aug 21) to ~70 (Aug 28) and is now rolling back down toward oversold again |
Divergence Check: On the 1H chart, price is currently near-equal to the Aug 24 low ($704–707 vs $703.9) while RSI (35.7) sits meaningfully above the Aug 24 RSI reading (which was sub-30, in the shaded oversold zone). If price holds above $704 here, this sets up a potential regular bullish divergence (equal/higher price low vs. higher RSI low) — a classic short-term reversal signal, though it is not yet confirmed since price hasn’t undercut the prior low.
Midline Confluence: Daily and 4H RSI are both testing the 50 line from above — how they resolve here (reject back down vs. reclaim) is the key near-term tell for whether this is a shallow pullback or a deeper corrective phase.
4. Technical Confluence Synthesis
This is the standout zone in the entire dataset:
- Price: $704–708 is a quadruple-confluence support — Weekly nothing major (next real weekly support is $667), but Daily lower band ($704.11), 4H lower band ($705.02), and 1H lower band ($704.91) are all stacked within a $1 range, alongside the psychological $700–$705 shelf and the prior Aug 24 / late-July swing lows.
- Momentum: 1H RSI is approaching oversold with early signs of bullish divergence forming, while Daily/4H RSI are testing (not yet breaking) the 50 midline from above.
- Structure: Weekly trend remains intact (higher-low structure since April 2025); the pullback is occurring within that larger uptrend, at the weekly basis — a common “buy the dip in an uptrend” location, provided $700 psychological support holds.
High-probability zone: $704–708 — where lower-timeframe oversold/divergence conditions meet multi-timeframe band support, inside a still-intact higher-timeframe uptrend.
The counter-argument (bearish case): Daily and 4H structure are unambiguously making lower highs/lower lows short-term, and if $704 breaks with conviction, the next real technical floor isn’t until the $690s (recent daily consolidation shelf) or the weekly lower band near $667.
5. Sentiment Gauge
Overall: 🟡 Neutral-to-Cautious (leaning bearish near-term, bullish structurally)
Key Catalysts:
- A global bond rout has sparked a tech selloff, with several names falling over 5%, pressuring growth/duration-sensitive Nasdaq names.
- Markets have turned more hawkish on Fed policy following Kevin Warsh’s Jackson Hole remarks, with a rate hike now being priced as more likely than a cut for the September meeting — a meaningful headwind for high-multiple tech. This tracks with an earlier read that had roughly a 54.5% probability priced for a 25bp September hike, suggesting the hawkish repricing has continued to build.
- Reports of a U.S.–Iran strike exchange have added a geopolitical risk-off bid to volatility.
- Longer-term, the AI infrastructure buildout remains a major structural tailwind, with hyperscaler capex projected to exceed $650 billion in 2026 and technology-sector earnings growth estimated above 46%, led by names like NVIDIA, Microsoft, Apple, and Amazon.
- Some strategists still frame QQQ’s tech concentration as core to the 2026 growth story, pointing to broad exposure and low cost as reasons flows keep favoring the sector even through pullbacks.
Crowd Sentiment: QQQ has seen net outflows of roughly $1.45 billion over a recent five-day stretch, suggesting some short-term de-risking/profit-taking rather than a structural exodus — consistent with a corrective pullback narrative rather than a trend reversal.
🟢 Bullish Drivers:
- Intact weekly uptrend, price still above the 2025–2026 higher-low structure
- Massive AI capex and earnings-growth tailwind for top holdings
- 1H RSI approaching oversold with early bullish divergence signs
🔴 Bearish Drivers:
- Hawkish Fed repricing pressuring growth-stock valuations
- Global bond rout driving cross-asset de-risking in tech
- Geopolitical flare-up adding risk-off pressure
- Daily/4H RSI below 50, confirming a short-term downtrend on the 4H chart
6. Final Actionable Trading Ideas
Idea #1 — Swing Long (Buy the Dip at Confluence Support)
- Direction: Long
- Rationale: Price is testing a rare multi-timeframe band-support confluence ($704–$708) within an intact weekly uptrend, while 1H RSI approaches oversold with nascent bullish divergence (see Section 3). This mirrors the late-July setup described in Section 2 that produced a $70+ rally.
- Execution Trigger: Wait for a 1H bullish reversal candle (e.g., hammer/engulfing) printing above $704, ideally with 1H RSI turning up from below 35 without price making a new low — confirms the divergence noted above.
- Risk Management:
- Stop Loss: Below $700 (clears the psychological level and the 1H/4H/Daily band cluster identified in Section 4; a close below invalidates the multi-timeframe support thesis).
- T1: $718–$720 (Daily/4H basis + prior 4H resistance)
- T2: $730–$732 (Daily upper band / early-Aug swing high)
Idea #2 — Day Trade Short (Trend-Continuation, Fade the Bounce)
- Direction: Short (only if $704–$705 breaks decisively)
- Rationale: 4H structure is a clean descending channel (Section 1) with momentum below the 50 midline on both Daily and 4H RSI (Section 3); a breakdown through the band cluster would confirm sellers are in control and open a move to the next daily support shelf.
- Execution Trigger: Wait for a 1H or 4H candle to close below $704 with RSI making a fresh low (no divergence) — confirms trend continuation rather than a reversal trap.
- Risk Management:
- Stop Loss: Above $713–$714 (4H basis / broken support-turned-resistance)
- T1: $695–$690 (August daily consolidation shelf)
- T2: $680–$667 (weekly lower band / late-July capitulation zone, per Section 1)
Bottom line: The $704–$708 zone (Section 4) is the pivot for the next several sessions. Holding it favors Idea #1 (dip-buy within the larger uptrend); a confirmed break favors Idea #2 (short-term trend continuation lower). Given the mixed macro backdrop — hawkish Fed repricing vs. a strong AI-earnings tailwind (Section 5) — position sizing should stay conservative until one of the two triggers confirms.
This is a technical analysis for educational purposes, not financial advice — position sizing, stop discipline, and your own risk tolerance should govern any actual trade decisions.
Leave a Reply
You must be logged in to post a comment.