
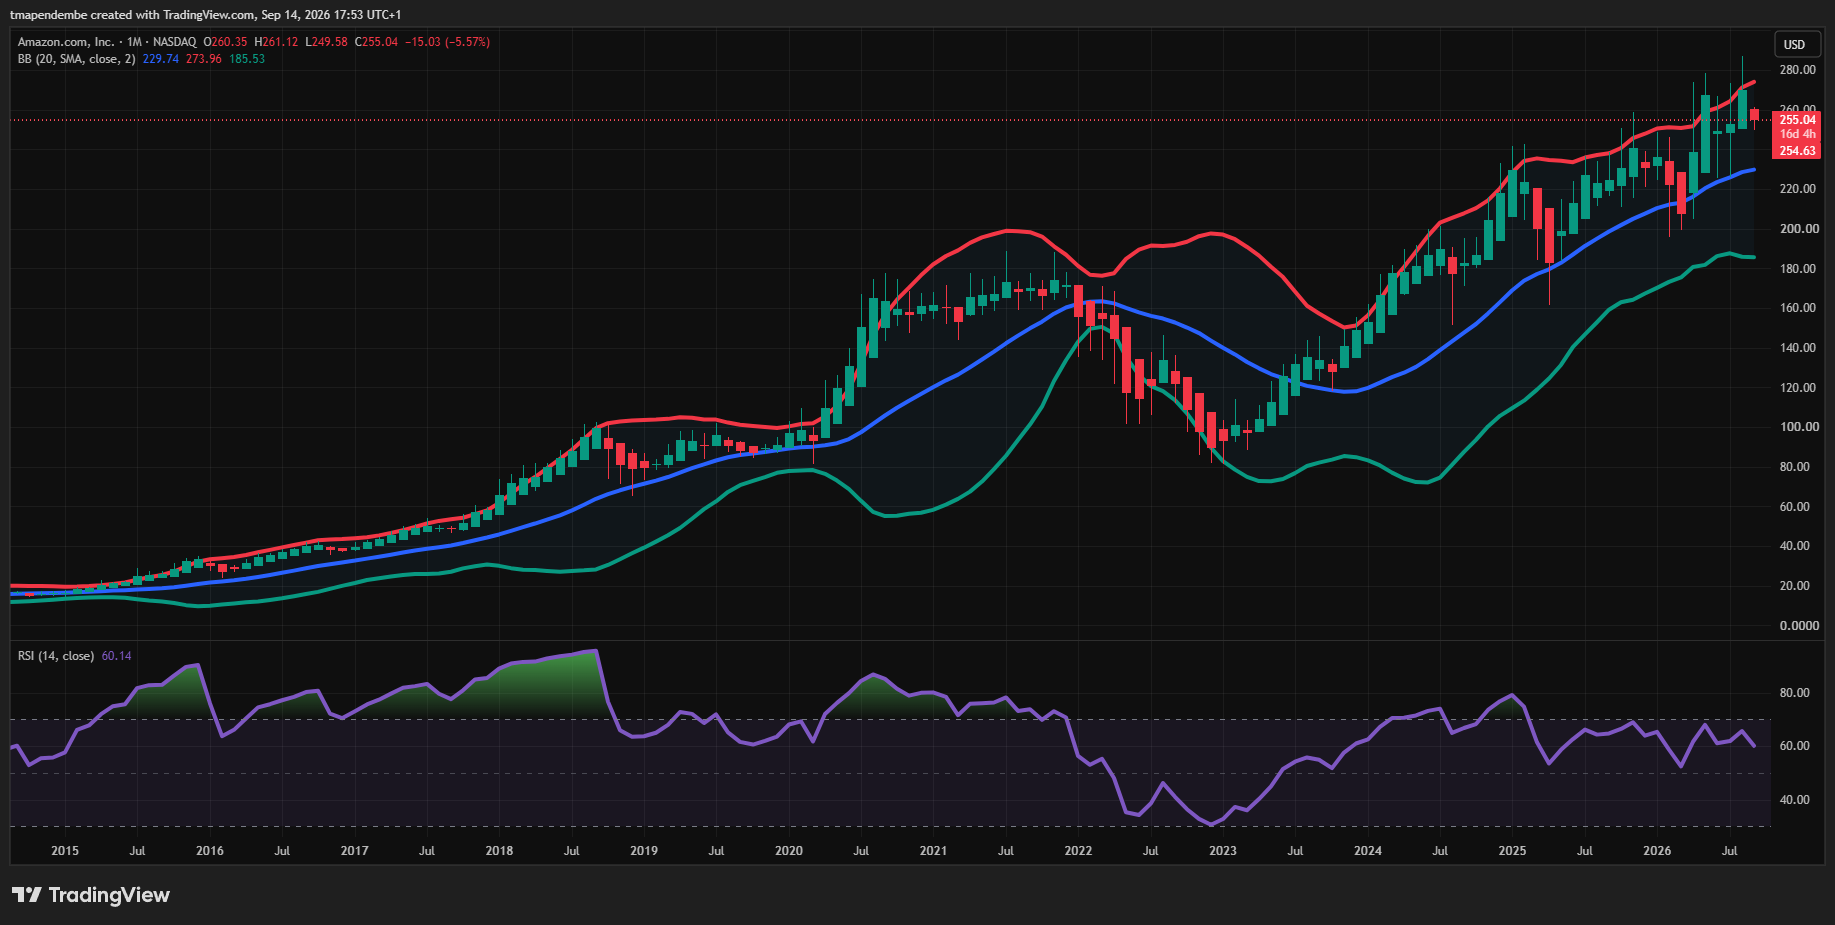
A forensic, Buffett/Graham-style fundamental analysis of Amazon.com Inc. (NASDAQ: AMZN) — moat strength, five-year financial trends, and a conservative intrinsic value / DCF estimate versus the current share price of ~$252 (September 2026).
Executive Summary
Amazon is, by any measure, one of the most dominant businesses on the planet — a $716.9 billion revenue empire spanning e-commerce, cloud infrastructure, advertising, and logistics. But “great business” and “great investment” are two different questions in the Buffett/Graham framework. This report applies the four pillars of moat-and-value analysis — Business, Moat, Financials, and Valuation — with deliberate skepticism, and concludes with an explicit rating below.
1. The Business Pillar: Understandability & Predictability
How Amazon makes money. Amazon operates through three disclosed segments: North America and International retail (product and third-party marketplace sales, ~72% of FY2025 revenue), Amazon Web Services (cloud infrastructure, the primary profit engine), and a fast-growing advertising business embedded within the retail and streaming ecosystem. The retail engine is a low-margin, high-volume logistics business; AWS and advertising are high-margin, capital-intensive technology businesses. This bifurcated model is moderately complex — it is not a “See’s Candies”-style simple business Buffett could explain in one sentence, but it is understandable: Amazon sells goods more efficiently than most retailers and rents out computing infrastructure at scale.
Circle of competence test. The core retail/logistics/marketplace model is well within an ordinary investor’s understanding. AWS and the accelerating AI infrastructure buildout, however, introduce real technological disruption risk (the durability of AI capital spending, custom silicon economics, and hyperscaler competitive dynamics are genuinely hard to forecast even for experts). A conservative investor should treat Amazon as “understandable at the edges, uncertain at the frontier.”
Management & capital allocation. CEO Andy Jassy (since 2021) draws a symbolic $365,000 base salary — standard across Amazon’s senior executive team — with the bulk of compensation in restricted stock. Founder and Executive Chair Jeff Bezos still holds roughly an 8% stake worth an estimated $225 billion and has never accepted stock-based compensation, a genuine and rare “skin in the game” signal (Fortune; Yahoo Finance). That said, two capital-allocation flags stand out for a Graham-style skeptic:
- Buybacks are essentially dormant. Amazon authorized a single $10 billion repurchase program in March 2022, spent roughly $6 billion of it that year, and has bought back zero dollars of stock in 2023, 2024, or 2025 (LegalClarity; TheStreet).
- Stock-based compensation (SBC) is large and persistent — roughly $20–24 billion per year, equivalent to 25–30% of GAAP net income in most recent years, with $16.9 billion of unrecognized SBC still to be expensed as of year-end 2025. With no offsetting buyback program, this is a continuous, low-grade dilution mechanism that a value investor must underwrite into normalized earnings, not add back uncritically.
Verdict: management is rational and long-term oriented, reinvesting nearly all cash into the business rather than paying it out — a defensible strategy for a founder-led compounder, but one that pushes essentially all capital-allocation risk onto the shareholder’s judgment of future returns on that reinvested capital.
2. The Moat Pillar: Sustainable Competitive Advantage
| Moat Type | Strength | Evidence |
|---|---|---|
| Cost Advantage | Wide | Unmatched logistics density (same-day/next-day delivery network) and AWS’s economies of scale in data-center construction and custom silicon (Graviton, Trainium) undercut smaller cloud rivals on unit cost. |
| Switching Costs | Narrow-to-Wide (AWS specifically) | Enterprises that build on AWS’s proprietary APIs, IAM, and managed services face real migration costs; retail customers face almost none. |
| Network Effects | Narrow | The marketplace (more sellers draw more buyers, and vice versa) and the advertising flywheel exhibit real, if modest, network effects; not as strong as a true two-sided platform monopoly. |
| Brand/Pricing Power | Narrow | Gross margin has expanded steadily from 42.0% (2021) to 50.3% (2025) — evidence of mix-shift toward high-margin AWS/ads, not classic retail pricing power. Amazon’s retail margins remain thin and price-competitive; it cannot raise prices on commoditized goods the way Apple or Coca-Cola can. |
Overall moat rating: Wide, driven almost entirely by AWS’s cost/switching-cost advantages and the Prime/marketplace flywheel — but the retail segment on its own would only qualify as Narrow-to-None. This is a “sum of the parts” moat rather than a single, clean Buffett-style moat.
3. The Financial Pillar: The Numbers (FY2021–FY2025)
| Metric (FY, $B unless noted) | 2021 | 2022 | 2023 | 2024 | 2025 |
|---|---|---|---|---|---|
| Revenue | 469.8 | 514.0 | 574.8 | 638.0 | 716.9 |
| Gross Margin | 42.0% | 43.8% | 47.0% | 48.9% | 50.3% |
| Operating Margin | 5.3% | 2.4% | 6.4% | 10.8% | 11.2% |
| Net Margin | 7.1% | -0.5% | 5.3% | 9.3% | 10.8% |
| Net Income | 33.4 | (2.7) | 30.4 | 59.2 | 77.7 |
| Free Cash Flow | (14.7) | (16.9) | 32.2 | 32.9 | 7.7 |
| Total Debt | 116.4 | 140.1 | 135.6 | 130.9 | 153.0 |
| Stockholders’ Equity | 138.3 | 146.0 | 201.9 | 286.0 | 411.1 |
| Debt/Equity | 0.84 | 0.96 | 0.67 | 0.46 | 0.37 |
| ROE (approx.) | ~29% | -1.9% | ~17.5% | ~24.3% | ~22.3% |
| ROIC (approx., NOPAT basis) | ~9.1% | ~4.2% | ~11.2% | ~16.2% | ~13.6% |
Sources: Amazon 10-K/ARS filings (SEC EDGAR FY2025 ARS, FY2024 ARS), StockTitan financial data, TipRanks financials.
Red flags a skeptical analyst must flag:
- ROIC is inconsistent and has never durably cleared 15%. It only touched 16.2% in FY2024 before slipping back to ~13.6% in FY2025 as AI-related capex expanded the invested-capital base faster than NOPAT grew. Buffett’s 15% hurdle is met in only one of the last five years.
- Free cash flow has collapsed again — this time more severely. FY2025 FCF fell to just $7.7 billion (down from $32.9B in 2024) as capital expenditures surged to $131.8 billion. The trend has since worsened materially: trailing-twelve-month FCF turned negative (roughly -$7.6B to -$11B) through mid-to-late 2026 as quarterly capex ran at $43–44 billion, with full-year 2026 capex now guided to roughly $200–220 billion (CNBC; Phemex; AL Capital Advisory).
- Debt payback via FCF fails the 3–4 year test. Even using the healthier FY2023–24 average FCF of ~$32.5 billion, Amazon’s ~$150 billion of total debt would take ~4.6 years to retire — and using the depressed FY2025/TTM figures, the payback period stretches past a decade or is mathematically undefined while FCF is negative. This is a genuine departure from Graham’s conservative debt-coverage standard.
- Leverage itself is improving. Debt/Equity has fallen from 0.96 (2022) to 0.37 (2025) as retained earnings compound equity faster than debt grows — a genuine positive, and ROE is not artificially inflated by leverage (equity is growing, not debt).
- Margins are expanding, consistently, for five straight years — the one unambiguously clean trend in the entire financial picture, driven by AWS/advertising mix-shift.
4. The Valuation Pillar: Margin of Safety
Current price: ~$252.10 (September 14, 2026) | Market cap: ~$2.8 trillion.
Multiples. Trailing P/E sits around 20–21x (TTM), with forward P/E near 24x (GuruFocus) — well below Amazon’s own distorted five-year average (skewed upward by the near-zero-earnings year of 2022), and a PEG ratio that has ranged from roughly 0.2 to 1.8 depending on the quarter measured, reflecting extremely volatile trailing earnings growth rather than a stable, trustworthy signal (fullratio.com PEG history; stockanalysis.com ratios).
Graham Number cross-check. Using FY2025 diluted EPS of $7.17 and book value per share of ~$37.96, the classic Graham Number (√(22.5 × EPS × BVPS)) comes out to approximately $78 — a rough, deliberately conservative ceiling on what a defensive Graham-style investor should pay, and roughly 69% below the current market price.
Two-Stage DCF (10% discount rate). Because trailing free cash flow is currently negative and management has guided to continued heavy 2026 capex (~$200–220B), a strict owner-earnings DCF cannot simply extrapolate the historical average. A conservative path was modeled instead:
- Year 1 (2026): -$10B (guided negative FCF)
- Year 2 (2027): $10B (partial recovery as capex growth decelerates)
- Year 3 (2028): $35B
- Year 4 (2029): $55B
- Year 5 (2030): $75B (well below the ~$176B “bull case” some sell-side models project)
- Terminal growth: 3.0% in perpetuity thereafter
Discounting these cash flows at 10% yields a present value of Stage 1 cash flows of roughly $110 billion and a present value of the terminal value of roughly $685 billion, for a total enterprise value near $795 billion. Subtracting net debt (~$66 billion) implies an equity value of roughly $729 billion, or approximately $67 per diluted share (~10.8 billion diluted shares outstanding).
Even doubling every one of the recovery-year cash flow assumptions (a distinctly optimistic case) only pushes intrinsic value into the $130–140 per share range — still far below the current market price.
Margin of Safety: At a conservative intrinsic value of roughly $65–$70 per share against a market price of ~$252, the stock is trading at a premium of well over 250% to strict owner-earnings intrinsic value — i.e., a large negative margin of safety under this framework. This stands in sharp contrast to Wall Street’s own consensus, which rates AMZN a Strong Buy with an average price target near $323–$328, implying roughly 28–30% upside from current levels (MarketBeat via ad-hoc-news). The gap between the two views is the entire investment debate: Wall Street is pricing Amazon on the assumption that today’s $200 billion AI capex converts into durable future earnings power; a strict Graham/Buffett owner-earnings framework refuses to pay today for cash flows that remain unproven and, at present, are negative.
Final Output & Rating Conclusion
1. Economic Moat Rating: WIDE — driven almost entirely by AWS’s scale/switching-cost advantages and the Prime/marketplace flywheel; the standalone retail segment would only merit Narrow-to-None.
2. Intrinsic Value Estimate: ~$67.00 (conservative DCF) vs. Current Price of ~$252.10
3. Final Investment Rating: SELL
Under the strict, conservative thresholds this analysis was asked to apply, Amazon fails the margin-of-safety test decisively. This is not a verdict that Amazon is a bad business — the moat is real, margins are expanding, leverage is improving, and management is disciplined and founder-aligned. But a Buffett/Graham investor pays for demonstrated, normalized owner earnings, not for a growth story funded by currently negative free cash flow and a $200 billion capital-expenditure bet whose payback period is unproven. At ~3.7x the conservative DCF intrinsic value (and ~69% above even the more generous Graham Number), AMZN currently offers no margin of safety by this discipline, regardless of how the market or sell-side consensus is pricing the AI buildout. A patient value investor would place Amazon on a watchlist and wait for either a much lower price or clear evidence that AI-related capex is converting into durable, growing free cash flow.
4. Key Risks (Top 2 Catalysts That Could Break the Thesis Further or Validate a Re-Rating):
- AI capex fails to monetize on schedule. If the ~$200–220 billion of 2026 AI/AWS infrastructure spending does not translate into proportionate AWS revenue and margin growth, free cash flow could remain suppressed or negative for years, forcing Amazon to raise additional debt or equity (which the company has already flagged as a possibility in SEC filings) — diluting shareholders or increasing leverage right as the balance sheet had been improving.
- AWS/retail competitive and regulatory pressure. Accelerating competition from Microsoft Azure, Google Cloud, and a wave of AI-native infrastructure providers, combined with ongoing antitrust and FTC scrutiny of Amazon’s advertising and marketplace practices, could compress the very margins that have driven five straight years of gross-margin expansion — the one unambiguously positive trend in this entire analysis.
This report is for educational and informational purposes only and does not constitute personalized investment, legal, or financial advice. All figures are drawn from public filings and financial data providers cited inline as of September 2026 and are subject to revision. Past performance and analyst price targets are not guarantees of future results.
Leave a Reply
You must be logged in to post a comment.