

Apple Inc. (NASDAQ: AAPL) | Weekly · Daily · 4H · 1H Data as of September 3, 2026, 17:36 UTC+1
Apple (AAPL) is in a bullish technical structure across all four timeframes, having reversed off a post-earnings double bottom near $299–$305 and rallied back toward the $330–$340 resistance shelf. Momentum remains strong on the Daily and 4H, but the 1H is overbought and the Weekly shows early RSI divergence — favoring pullback entries over chasing the current highs.
1. Multi-Timeframe Structural Analysis
Weekly (Macro Trend)
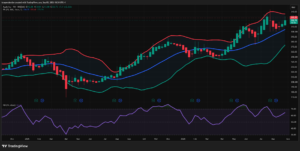
- Structure: Strong uptrend intact. After a violent decline from ~$250 (Feb 2025) to ~$170 (Apr 2025), price has carved a sequence of Higher Highs/Higher Lows through a multi-leg recovery, punctuated by two multi-month consolidations (mid-2025 and Q1 2026) before an explosive Mar–Jul 2026 impulse to all-time highs near $340–$345.
- Key Levels: Resistance at the $335–$344 ATH shelf; structural support at $295–$300 (Aug 2026 higher low), then $250–$260 (prior cycle high, now support), with $225–$230 as the deep macro floor.
- Bollinger Bands: Squeezed tightly through Jan–Mar 2026 (classic pre-breakout contraction), then expanded violently into the rally. Currently re-expanding as price pushes back toward the upper band after the Jul–Aug pullback — price is riding the upper band, typical of strong trending behavior.
Daily (Intermediate Trend)
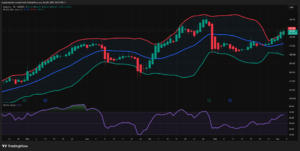
- Structure: Bullish, with a clean higher-low correction. Rallied from ~$260 (Apr) to ~$340 (late Jul), suffered a sharp earnings-driven drop to ~$300, based between $299–312 for two weeks, then resumed the uptrend to $327–$330.
- Key Levels: Immediate resistance $330–$334, then the $340 ATH. Support stacked at $312 (mid-BB) and $299–$300 (post-earnings low, lower BB touch).
- Bollinger Bands: Price has been walking the upper band since Aug 15, signaling strong momentum; the rising mid-band ($312.50) has flipped into dynamic support.
4-Hour (Swing Trend)
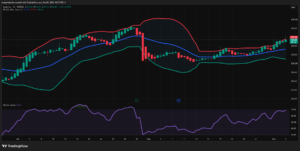
- Structure: Clear V-shaped recovery — sharp earnings gap-down (Jul 30–31) into a double-bottom base at ~$299–$305 (Aug 1–13), followed by a persistent higher-low grind back to $330.
- Key Levels: Resistance $330–$333; support at rising mid-band $316.28 and prior base $304–$307.
- Bollinger Bands: Contracted hard during the Aug basing phase (volatility squeeze), then expanded as price broke out and is now riding the upper band ($327.79) — a classic “band walk” continuation signature.
1-Hour (Execution Trend)
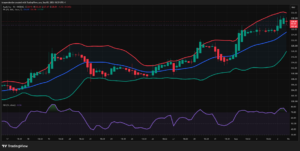
- Structure: Aggressive short-term uptrend with a defined pullback (Aug 27–31 dip to ~$308) before a sharp breakout leg into current highs.
- Key Levels: Immediate resistance $330–$332; support $325 (basis) and $320 (breakout retest level).
- Bollinger Bands: Currently riding/squeezing the upper band ($332.11) with RSI at 77.68 — extended short-term, though band-riding in an impulsive move often persists before a mean-reversion pause.
2. Price Action & Candlestick Patterns
- 4H — Bearish Marubozu (Jul 30–31): A large-bodied red candle with minimal wicks broke below the mid-band decisively — the earnings-reaction candle that triggered the entire pullback.
- 4H/Daily — Hammer / Long-Lower-Wick Reversal (Aug 1): A candle with a long lower wick tagging the lower Bollinger Band (~$299) marked capitulation and the start of the base.
- Daily — Double Bottom (~$299–$305, Aug 1 & Aug 13): Two tests of the same low with a rounded “cup” recovery in between — the reversal structure that fueled the current leg.
- 1H — Bullish Continuation Cluster (Sep 1–2): Small-bodied doji/spinning-top candles consolidating just under the upper band around $326–328, resolving with a decisive bullish breakout candle into the $330 high — a bull-flag-style pause and continuation.
- Weekly — Back-to-back strong bullish candles closing near the highs, pressing directly into the prior ATH resistance shelf.
3. RSI Momentum & Divergence Analysis
| Timeframe | RSI (14) | Zone | Notable Signal |
|---|---|---|---|
| Weekly | 64.6 | Neutral-bullish | Lower RSI peak than the Jun/Jul high despite price approaching a similar level → early-stage bearish divergence risk on any marginal new high |
| Daily | 65.6 | Neutral-bullish | Climbing steadily off the post-earnings low (~30) with no overbought reading yet — room to run |
| 4H | 69.2 | Approaching overbought | Sustained just under 70 for several sessions — momentum strong but not yet exhausted |
| 1H | 77.7 | Overbought | Sustained above 70 through the current push; elevated risk of a short-term pullback/consolidation |
- Divergence Check: On the 4H/Daily, the Aug 13 price low was roughly equal to the Jul 31 low, while RSI printed a higher low on the second test (~40s vs. ~28–30) — a constructive regular bullish divergence that preceded the current rally.
- Midline Confluence: On the 4H and 1H, every pullback since the breakout (Aug 27–31 dip, Sep 1–2 pause) found support at or above the RSI 50 midline, confirming the intermediate trend remains bullish-controlled.
- Caution flag: The 1H overbought reading combined with the weekly’s diminishing RSI peak is the main point of friction in an otherwise aligned bullish picture — watch for a shallow pullback/consolidation before the next leg.
4. Technical Confluence Synthesis
High-probability confluence (already realized): Early August 2026 — a Daily/4H hammer at the lower Bollinger Band (~$299), coinciding with a regular bullish RSI divergence and a double-bottom chart pattern, at a level that also aligned with the Weekly $295–$300 support shelf. This confluence correctly flagged the reversal that has driven price back to $330.
Current confluence (forward-looking):
- The Weekly is testing the $335–$344 ATH resistance with a softening RSI peak (divergence risk).
- The Daily/4H are still trending cleanly with RSI below overbought, giving room to extend.
- The 1H is overbought and band-riding, suggesting the next few hours/sessions likely see either (a) a shallow pullback to the 1H mid-band (~$325) that refreshes the setup, or (b) a momentum blow-off toward the weekly ATH shelf before any real reversal.
- Net read: bullish continuation bias, but positioned late in the swing — pullback entries are preferable to chasing the extended 1H candle.
5. Sentiment Gauge
🎯 Overall: Bullish (with growing caution)
Key Catalysts:
- Apple has scheduled a September 9, 2026 product event in Cupertino, and reports suggest a first foldable iPhone could meaningfully boost December-quarter hardware revenue, per MarketBeat’s AAPL forecast coverage.
- Apple’s most recent quarter beat expectations on both revenue and EPS, and the company has raised prices on high-margin Services offerings, as detailed by MarketBeat and corroborated by Yahoo Finance’s earnings recap.
- A historic leadership transition took effect September 1, 2026, as John Ternus became Apple’s first new CEO since 2011, with the stock rallying that day even as the broader market fell — see The Motley Fool’s report and CNBC’s ongoing coverage.
- On the bearish side, a same-day report indicates a research firm believes Apple has cancelled two planned MacBook models, and Jefferies downgraded AAPL to “Sell” following reports of an all-glass iPhone cancellation, per StockAnalysis.com.
- Apple also carries a bear-case overhang tied to its premium valuation, memory-cost margin pressure, softer smartphone/PC end markets, and a recently filed lawsuit against OpenAI, as outlined in Yahoo Finance’s analysis.
Crowd / Institutional Sentiment:
- CNBC reports options traders have been taking bullish positions in Apple shares heading into the September 9 event.
- Rosenblatt raised its price target ahead of the iPhone launch citing expectations for higher iPhone prices and a richer premium-product mix — though the firm’s own target still implies downside, and analyst consensus targets have generally lagged the stock’s rally.
- Retail sentiment had earlier cooled following Apple’s WWDC 2026 event, when the lack of a firm Siri AI launch timeline briefly spooked investors — a reminder that AI-roadmap clarity remains a swing factor for sentiment into the Sept 9 event.
🟢 Bullish Drivers:
- September 9 launch event / potential foldable iPhone revenue catalyst
- Strong recent earnings beat + Services price hikes (MarketBeat)
- Bullish options flow and a smooth CEO transition (CNBC, The Motley Fool)
- Technical structure: uptrend, price above rising moving averages/bands on 4H–Weekly
🔴 Bearish Drivers:
- Jefferies “Sell” downgrade + reported MacBook cancellations (StockAnalysis.com)
- Stretched valuation vs. below-price average analyst targets (Yahoo Finance, Rosenblatt via Yahoo Finance)
- 1H RSI overbought / weekly RSI divergence forming near ATH resistance
- OpenAI litigation overhang, margin pressure from memory costs (Yahoo Finance)
6. Final Actionable Trading Ideas
Idea 1 — Swing Trade (Daily/4H): Buy-the-Dip Continuation — LONG
- Rationale: The dominant Daily/4H/Weekly trend remains bullish, momentum (RSI) is not yet overbought on these timeframes, and the base built at $299–305 (double bottom + bullish RSI divergence) provides a well-defined structural floor. The 1H overbought condition argues for waiting for a pullback rather than chasing strength.
- Execution Trigger: Wait for a pullback/consolidation into the 4H mid-Bollinger Band (~$318–$320) or a 1H bullish reversal candle (hammer/engulfing) off the $320–$322 zone, ideally with 1H RSI resetting back toward 50 before turning up.
- Risk Management:
- Stop-Loss: Below $311–$312 (Daily mid-band and the most recent 4H swing low) — a break here invalidates the higher-low structure.
- Take Profit 1: $330–$334 (recent swing high / Daily upper band).
- Take Profit 2: $340–$345 (Weekly ATH / upper Bollinger Band resistance).
Idea 2 — Day Trade/Scalp (1H): Fade the Overbought Extension — SHORT (tactical, counter-trend)
- Rationale: 1H RSI at 77.7 while price rides the upper Bollinger Band is a classic short-term exhaustion signature, especially with the Weekly showing a softening RSI peak near ATH resistance. This is a mean-reversion scalp against an otherwise bullish higher-timeframe trend — sized small and time-limited.
- Execution Trigger: Enter on a 1H bearish reversal candle (shooting star/bearish engulfing) closing back inside the upper band (below ~$330), confirming rejection rather than pre-empting it.
- Risk Management:
- Stop-Loss: Above $332 (beyond the 1H upper band / session high) — invalidates the rejection thesis.
- Take Profit 1: $325 (1H mid-band / basis).
- Take Profit 2: $320 (prior 1H breakout support / value area).
Overall Bias: Structurally bullish across higher timeframes; tactically due for a short-term cooling-off period given 1H overbought readings and a maturing Weekly RSI. Favor buying pullbacks over chasing highs, and treat any short as a scalp against the dominant trend, not a trend-reversal position — especially with the September 9 product event acting as a binary volatility catalyst just ahead.
Sources
- MarketBeat — Apple (AAPL) Stock Forecast & Price Target
- The Motley Fool — Why Is Apple Stock Up Today?
- CNBC — AAPL: Apple Inc. Stock Price, Quote and News
- Yahoo Finance — Apple WWDC 2026: AAPL Stock Slips As Lack Of Launch Deadline For Siri AI Spooks Retail Investors
- Yahoo Finance — AAPL Stock Price Target Hiked Ahead Of iPhone Launch
- StockAnalysis.com — Apple (AAPL) Stock Price & Overview
- Investing.com — Apple Stock Price Today
- Yahoo Finance — Apple Is Up 20% in 2026. What Will It Take for AAPL Stock to Hit $350?
- ad-hoc-news.de — Apple stock edges higher as September 9 event nears
This report is for informational and educational purposes only and does not constitute financial or investment advice. Technical analysis reflects probability, not certainty — always apply independent risk management.
Leave a Reply
You must be logged in to post a comment.