
Share dilution, earnings per share (EPS) erosion, and diluted share count are three of the most critical concepts every investor must master — and if you’ve ever watched your portfolio shrink overnight while a company cheerfully announced it was “raising capital for growth,” then congratulations, you’ve already been introduced to dilution. It didn’t shake your hand first, either. It just walked straight into your wallet and helped itself.
Look, I’m a trader. I spend my days staring at charts, balance sheets, and SEC filings. And I can tell you right now: share dilution is the financial equivalent of ordering a large pizza, going to get plates, and coming back to find someone has cut it into forty extra slices. You thought you had a big slice. Now you’ve got a cracker.
But here’s the thing — dilution isn’t always bad. Sometimes companies issue shares to fund legitimate, value-creating growth. Amazon diluted shareholders. So did Apple in its early days. The key is knowing the difference between dilution that builds your wealth and dilution that quietly pickpockets it. That’s what this guide is all about.
In this article, we’ll break down exactly what share dilution is, how to measure it, what the academic research tells us about its impact, and — crucially — the red flags you must know to protect yourself as an investor. We’ll look at real case studies, do the maths, and have a few laughs along the way. Because if you can’t laugh at your portfolio getting diluted, you’ll only cry. And crying doesn’t close positions.
1. What Is Share Dilution? The Definition You Actually Need
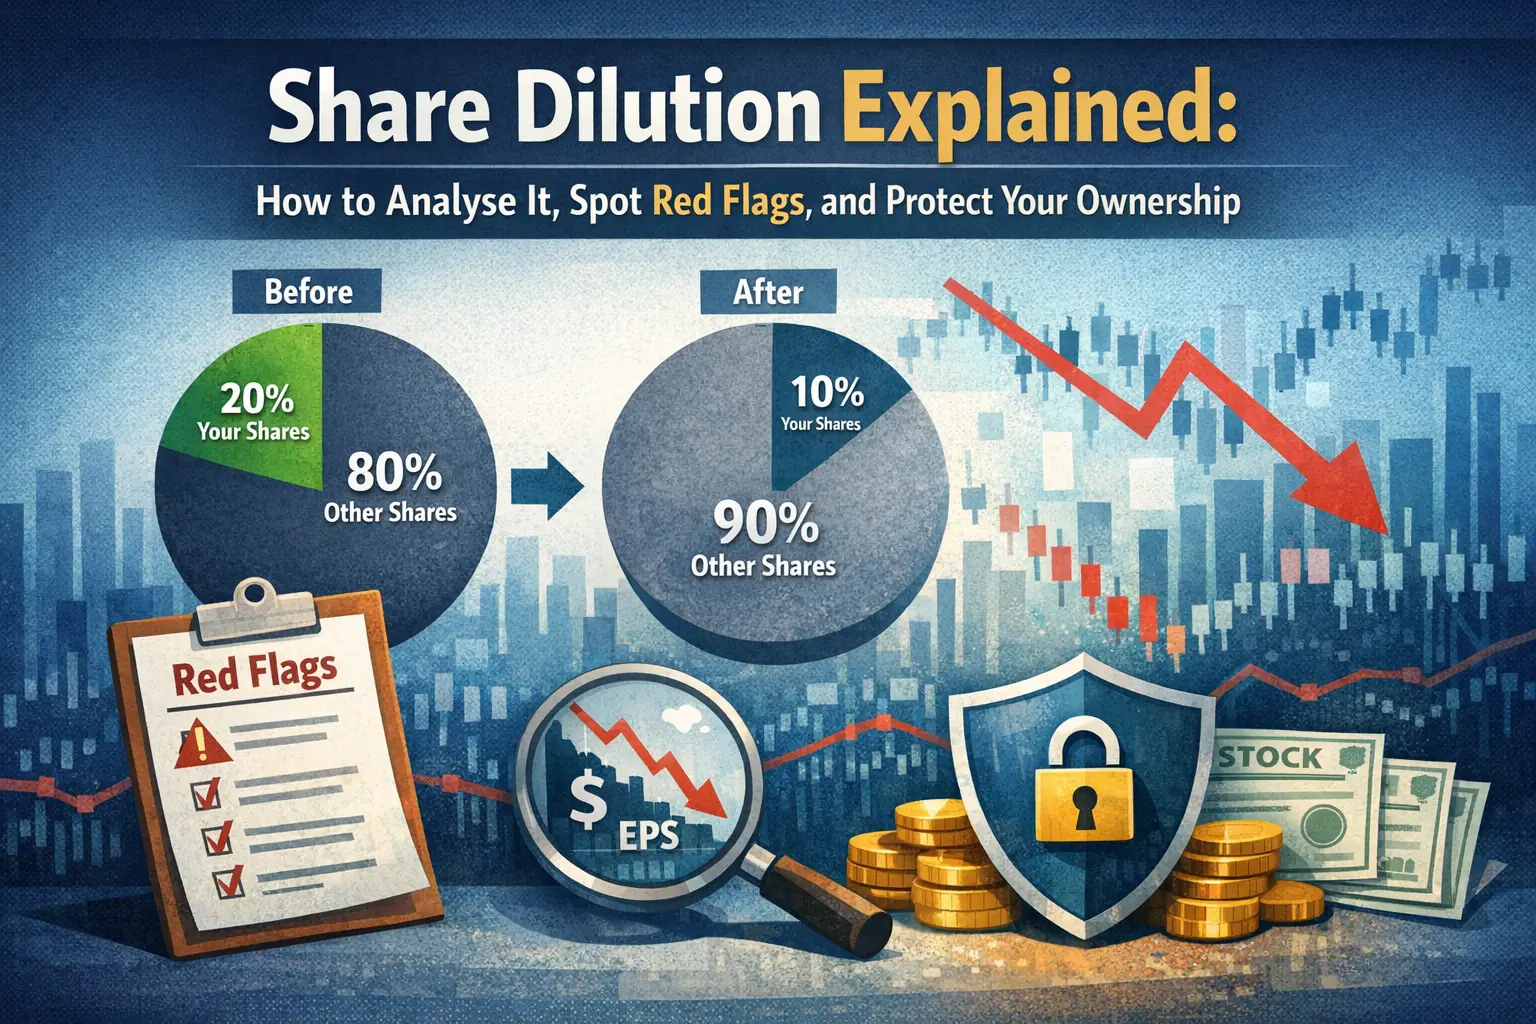
Share dilution occurs when a company issues new shares, thereby reducing the percentage ownership of existing shareholders. If you own 100 shares out of 1,000 total, you own 10% of the company. If the company then issues 1,000 new shares and you don’t buy any of them, you now own 100 out of 2,000 — that’s 5%. Your piece of the pizza just got cut in half, and nobody even asked if you wanted pineapple on it.
Technically, dilution can come from several sources:
- New share issuance — the company sells new shares directly, typically through a secondary offering or a rights issue.
- Employee Stock Option Plans (ESOPs) — employees exercise stock options, creating new shares that enter the market.
- Convertible instruments — convertible bonds, convertible preferred shares, or warrants convert into equity, increasing the share count.
- Stock-based acquisitions — when companies use their own shares as currency to buy other companies, diluting existing holders.
According to Masulis and Korwar’s foundational study, “Seasoned Equity Offerings: An Empirical Investigation,” published in the Journal of Financial Economics (1986), the announcement of new equity offerings reduces stock prices significantly — with industrial issues showing a price drop related to the size of the offering. In other words, the market sees that dilution coming and immediately starts docking your pay. You can access their work here:
Masulis & Korwar (1986) — Journal of Financial Economics (ScienceDirect)
The reason markets react negatively is rooted in information asymmetry — the idea, developed by Myers and Majluf (1984), that managers only issue equity when they believe the stock is overvalued. So when a company announces new shares, the market interprets it as management effectively saying, “Hey, we think the stock is pricey right now.” That’s what economists call a negative signal. I call it management winking at you while picking your pocket.
2. The Maths of Dilution: Metrics Every Investor Must Track
2.1 Basic Dilution Percentage
The formula for dilution is straightforward:
Dilution % = (New Shares Issued ÷ Total Shares After Issuance) × 100
Example: A company has 10 million shares outstanding. It issues 2 million new shares.
Dilution = (2,000,000 ÷ 12,000,000) × 100 = 16.67%
Meaning existing shareholders just lost one-sixth of their ownership stake. Just like that. Gone. No warning. No apology. Just a press release with the word “opportunity” in it five times.
2.2 Earnings Per Share (EPS) — The Dilution Truth Teller
Earnings Per Share is calculated as:
Basic EPS    = Net Income ÷ Weighted Average Shares Outstanding
Diluted EPS  = Net Income ÷ (Shares Outstanding + Dilutive Securities)
Diluted EPS is the metric that actually matters for shareholders. It assumes every single convertible instrument, option, and warrant that could become a share has already done so. It’s the worst-case scenario number, and it’s the one management teams love to bury in the footnotes. The difference between basic EPS and diluted EPS tells you exactly how much potential dilution is hanging over your head like a financial sword of Damocles.
Example:
| Metric | Value |
|---|---|
| Net Income | £50 million |
| Basic Shares Outstanding | 25 million |
| Diluted Shares (incl. options & convertibles) | 30 million |
| Basic EPS | £2.00 |
| Diluted EPS | £1.67 |
| Gap | 16.5% |
That’s a 16.5% gap — a 16.5% reason to look up from your phone when reading earnings reports.
2.3 Share Count Growth Rate
Track this metric across multiple years:
Annual Share Count Growth Rate = ((Current Shares ÷ Prior Year Shares) - 1) × 100
As a practical rule of thumb, as outlined by TrueData’s comprehensive investor guide, annual dilution of around 1–2% is generally acceptable, 3–5% warrants closer scrutiny, and anything consistently above 5% can be a red flag unless backed by strong profit growth. You can review their analysis here:
TrueData — Share Dilution: Impact on Shareholders & Valuation Explained
I’ll add my own rule: if a company’s share count is growing faster than its revenue, earnings, or cash flows, you’ve got a problem. That’s like a bakery claiming it’s expanding by doubling the number of staff but selling the same number of loaves. Eventually, those staff want to get paid. In equities, that bill arrives in the form of diluted returns.
2.4 The Dilution-to-Earnings Growth Ratio
A metric I like to apply personally: compare the annual share count growth rate against earnings growth rate. If earnings per share are growing even after accounting for dilution, management is actually creating value. If EPS is flat or falling while share count rises, shareholder value is being quietly destroyed. Management is throwing a party and sending you the bill.
3. Types of Share Dilution — Not All Dilution Is Created Equal
3.1 Dilutive Secondary Offerings
A secondary offering occurs when a company issues new shares directly to the public. These can be priced at a discount to the current market price to attract buyers, which immediately pressures the stock. Research by Burkart and colleagues, published in the Review of Corporate Finance Studies by Oxford Academic, examined equity issuance methods across 41 countries and found that the method of issue — public offering versus rights offering — significantly affects wealth transfers among shareholders. You can access this peer-reviewed paper here:
Burkart et al. — Equity Issuance Methods and Dilution (Oxford Academic / LSE Eprints)
Secondary offerings at steep discounts are one of the fastest ways to anger existing shareholders. It’s the corporate equivalent of selling your neighbour a ticket to your own birthday party — at full price — and then letting new guests in for half that. Nobody’s pleased.
3.2 Rights Issues
A rights issue gives existing shareholders the right to buy new shares at a set price, usually at a discount, before the company offers them to the broader public. Done correctly, rights issues are actually fairer to existing investors because they’re given the first opportunity to maintain their proportional ownership. The problem is that not all shareholders have the cash to participate — particularly retail investors — meaning smaller shareholders often end up diluted anyway while institutional players scoop up the discounted shares.
3.3 ESOP Dilution — The Slow Burn
Employee Stock Options are the silent killers of EPS. They’re issued to employees as incentives, often with multi-year vesting schedules. They don’t show up on basic share count immediately, but they lurk in the diluted share figure. When a tech company tells you it’s paying its team in stock options, what it’s really saying to shareholders is: “We’ll handle payroll, but you lot will be splitting that bill in the future.”
For large tech companies, ESOP dilution of 1–3% per year can be entirely justified if the company is growing earnings at 20%+ per year. The maths work. For a struggling mid-cap whose earnings are flat, even 1% ESOP dilution is value destruction dressed up in a motivational HR policy.
3.4 Convertible Instruments — The Trojan Horse of the Balance Sheet
Convertible bonds and convertible preferred shares are forms of debt (or equity) that can convert into common shares under certain conditions — usually when the stock price hits a predetermined level. They look harmless on the balance sheet: they’re listed as liabilities, not equity. But they’re quietly waiting for the right moment to flip into shares and dilute every existing holder.
Warrants are particularly crafty. They give the holder the right to buy shares at a fixed price in the future. Companies — especially smaller-cap and penny stocks — love peppering their capital structures with warrants attached to financing deals. They’re like time bombs with a fixed detonation price. And when they go off, existing shareholders feel the blast first.
4. Case Studies — Dilution in the Real World
4.1 Case Study: AMC Entertainment — A Masterclass in Aggressive Dilution
AMC Entertainment is arguably the most high-profile modern case study in aggressive share dilution, and it’s a story that doubles as a cautionary tale for retail investors.
In early 2021, AMC was on the brink of bankruptcy. The meme stock frenzy — driven by retail investors coordinating on Reddit’s WallStreetBets forum — pushed AMC’s share price from under $3 to above $60. What happened next is a textbook example of a distressed company seizing a window to massively dilute shareholders while the market is temporarily irrational.
AMC’s management team, led by CEO Adam Aron, issued hundreds of millions of new shares throughout 2021 and 2022. AMC went from approximately 100 million shares to over 500 million shares in less than two years — a five-fold increase in share count. The Richmond Federal Reserve’s research note on GameStop and AMC captured this dynamic precisely, noting that companies in distress can use equity issuance to survive, but existing investors who hold through that dilution bear the real cost:
Richmond Fed — GameStop, AMC and the Self-Fulfilling Beliefs of Stock Buyers
AMC then invented the “APE” preferred equity units in 2022 — a move so creatively dilutive that even financial journalists had to double-check their notes. AMC distributed APE units to shareholders as a dividend, but those units were designed to eventually convert back into common shares. The market understood the game immediately: AMC shares fell heavily on the announcement. Shareholders who bought in during the meme rally at $50–60 per share saw their investment fall more than 95% in the subsequent years, partly because of the relentless dilution that followed.
The lesson? When a distressed company’s stock price spikes dramatically — not because of improving fundamentals but because of coordinated retail buying — management will almost always issue new shares to capitalise on that window. It’s rational for the company. It’s brutal for latecoming retail investors. As the social media analysis published in PMC confirmed, sentiment-driven price spikes during the GameStop and AMC era had little connection to underlying fundamentals:
This is why I always tell people: when a company you don’t understand is up 300% in three weeks, and the CEO is doing TikTok videos… that is not the time to buy. That is the time to sell him your shares. Respectfully.
4.2 Case Study: GameStop — Dilution Used as a Lifeline
GameStop’s story is more nuanced. Like AMC, GME benefited from the meme stock frenzy of early 2021, with its stock surging from under $5 to a peak of $483 intraday on January 28, 2021. But unlike AMC, GameStop used its elevated share price to raise substantial capital in a disciplined way.
In May 2024, when Roaring Kitty returned to social media and triggered a new GME spike, GameStop issued new stock at above $20 per share, raising over $900 million. The company used this capital to strengthen its balance sheet, giving it a cash war chest to pivot its business model — including a subsequent decision to explore cryptocurrency holdings.
The dilution was real — GameStop authorised an additional 75 million share offering and issued hundreds of millions of shares across multiple rounds. But because the share price was elevated at the time of issuance, and because the cash was being used productively to reduce financial stress and fund a strategic pivot, the dilution was arguably justified. This is the distinction that matters: dilution at artificially elevated prices for genuine business purposes is fundamentally different from chronic dilution to fund operating losses.
GameStop’s case is documented extensively. For academic context on the short squeeze mechanism, see:
Pomparelli, T. (2024) — The GameStop Short Squeeze as a Case Study in Business Law Education (SSRN)
4.3 Case Study: Tesla — When Dilution Doesn’t Matter (As Much)
Tesla has diluted shareholders consistently throughout its history — issuing new shares through multiple secondary offerings and massive stock compensation to its executives. Between 2010 and 2020, Tesla’s share count roughly doubled. In any other company, that scale of dilution might be catastrophic. In Tesla’s case, revenue and earnings grew so explosively that the dilution barely registered against the value creation.
This demonstrates the golden rule of dilution analysis: dilution is only destructive when the value created by the capital raised is less than the value lost through ownership dilution. If a company can raise $1 billion through dilution and generate $3 billion in future earnings from it, shareholders are better off. If a company raises $1 billion and burns it on losses and executive salaries, shareholders have been robbed — politely, in a press release, with bullet points about “strategic growth initiatives.”
If the CEO is on a yacht when he sends that press release, consider that a supplementary red flag. I’m just saying.
5. Investor Red Flags — Warning Signs You Cannot Ignore
🚩 Red Flag #1: Share Count Rising Faster Than Revenues or Earnings
Pull up the share count over five years. Pull up the revenue and earnings over the same five years. If shares are growing at 10% per year and earnings are growing at 5% per year, this company is eroding value. EPS is being diluted. Your ownership is shrinking. The maths are against you. Walk away, or at minimum, demand an explanation from management.
🚩 Red Flag #2: Heavily Loaded Convertible Instruments
Look at the notes to the financial statements — specifically any section on “convertible notes,” “warrants outstanding,” or “diluted share count.” If the gap between basic shares outstanding and fully diluted shares outstanding is more than 10–15%, you have a significant overhang of potential dilution. That stock options tower isn’t going to stay in the balance sheet forever.
I once looked at a small-cap company that had 50 million basic shares but 90 million fully diluted shares. That’s 80% potential dilution sitting in the footnotes like a financial Grim Reaper. Nobody talks about footnotes. That’s exactly why they put the bad stuff there.
🚩 Red Flag #3: Frequent “At-the-Market” (ATM) Offerings
“At-the-market” equity programmes allow companies to drip-feed new shares into the market continuously, without announcing a formal secondary offering. This avoids the big negative news event of a traditional secondary offering — but the cumulative dilution can be massive. If you see a company repeatedly filing a Prospectus Supplement with the SEC noting additional ATM offerings, watch your share count. Each of those filings is a sip from your cup.
🚩 Red Flag #4: Dilution Combined With Management Selling
If the company is issuing new shares AND insiders are simultaneously selling their existing shares, that is a two-alarm fire. The company is expanding the share pool while those who know the business best are reducing their stake. You don’t need a PhD in finance to understand that signal. When the people cooking in the kitchen aren’t eating the food, maybe don’t order the special.
🚩 Red Flag #5: Recurring Net Losses Funded by Equity Issuance
The most dangerous form of dilution is the “zombie company” pattern: a business that consistently loses money and funds those losses by issuing new shares. The share count grows every year. The losses continue every year. Eventually one of two things happens: the company pivots to profitability, or it dilutes shareholders into oblivion until the share price falls so low that raising meaningful capital becomes impossible.
This is sometimes called the “dilution death spiral” — particularly associated with certain structures like Toxic Convertible Notes, where lenders receive notes that convert into shares at a discount to market price, regardless of how low the market price falls. Each conversion dilutes existing holders further, drives the stock price lower, creates more conversions at even lower prices… and so on until shareholders are left holding confetti. Academic analysis confirms that markets punish heavily dilutive acquisitions and issuances:
HBS — Do Appearances Matter? The Impact of EPS Accretion and Dilution on Stock Prices
🚩 Red Flag #6: Dilution Through M&A — The Overvalued Acquirer’s Tax
When companies use their own shares to acquire other companies, existing shareholders are diluted by the deal. Whether this creates or destroys value depends on the valuation at the time of the acquisition and what the acquired business actually contributes. Overvalued acquirers paying for deals in stock can create massive long-term dilution that’s hard to spot until years later. The Harvard study above analysed 224 large transactions between 1975 and 1994 and found EPS dilution effects on stock returns — particularly significant when the acquisition was priced extremely dilutively.
6. How to Analyse Dilution — A Step-by-Step Framework
Step 1: Pull the Share Count History
Go to the company’s 10-K (or Annual Report in the UK). Look for “weighted average shares outstanding” under the basic and diluted EPS calculation in the income statement. Track this figure going back five years minimum. Calculate the compound annual growth rate (CAGR) of the share count. Compare it to revenue and earnings growth CAGRs over the same period.
Step 2: Examine the Diluted Share Count Gap
Compare basic shares outstanding with diluted shares outstanding. The difference represents the total potential dilution from options, warrants, and convertibles. Divide the difference by basic shares and express as a percentage. Anything above 10% is worth examining carefully. Above 20% is a significant red flag for most mature companies, though early-stage growth companies with heavy option pools may be exceptions.
Step 3: Read the Equity Issuance Footnotes
In the notes to the financial statements, look for sections titled: “Stock-Based Compensation,” “Equity Plans,” “Convertible Notes,” and “Warrants.” These sections will tell you the exercise prices of options, the conversion prices of notes, and the expiry dates of warrants. This tells you not just how many potential new shares exist, but at what price levels they’ll come into the market.
This step is not glamorous. Nobody’s making a podcast about reading footnote disclosures on a Friday night. But this is where the real information lives. The stuff they want you to skim past. Don’t skim. Read it like your money depends on it — because it does.
Step 4: Calculate Fully Diluted Market Cap
Most investors look at market cap as: share price × shares outstanding. That’s basic market cap. Fully diluted market cap is: share price × fully diluted share count. The difference can be substantial.
Example:
| Metric | Value |
|---|---|
| Basic Shares Outstanding | 50 million |
| Share Price | £10 |
| Basic Market Cap | £500 million |
| Fully Diluted Shares | 80 million |
| Fully Diluted Market Cap | £800 million |
You’re not paying for a £500m company — you’re paying for an £800m company with 50m shares currently outstanding and 30m more parked in options and warrants. Price accordingly.
Step 5: Assess Value Creation Against Dilution
Finally, contextualise everything. Dilution is not inherently bad. The question is always: is the value created by the capital raised greater than the value lost through ownership dilution? Ask these questions:
- Is the company using the raised capital to grow revenues and earnings?
- Is EPS improving over time even as share count rises?
- Is management compensating themselves reasonably relative to value created, or are they raiding the option pool?
If the answers point to genuine value creation, dilution is the price of growth — and it’s often worth paying. If the answers point to recurring losses, excessive executive compensation, and chronic share issuance, you’re not invested in a growth story. You’re invested in a slow-motion wealth transfer.
7. Anti-Dilution Protections — What to Look For
For investors in private companies or early-stage ventures, anti-dilution provisions in investment agreements are critical. These clauses protect early investors from having their stakes diluted in future funding rounds at lower valuations. The two main types are:
- Full Ratchet Anti-Dilution: If new shares are issued at a lower price than your entry price, the conversion price of your shares is adjusted down to match — giving you more shares to compensate. This is the most protective form, but also the most punishing to the company and to later-stage investors.
- Weighted Average Anti-Dilution: Adjusts the conversion price based on a weighted average of the old price and the new (lower) price, and the number of new shares issued. Less aggressive than full ratchet, but still provides meaningful protection. This is the more common standard in venture capital deals.
For public market investors, anti-dilution protections are rarer and harder to enforce. The main protection available to public shareholders is shareholder voting rights on equity issuances — many jurisdictions require companies to seek shareholder approval before issuing shares beyond a certain threshold. Know your rights as a shareholder. Read those proxy statements. Most people don’t. That’s exactly why management teams know they can get away with a lot more than they should.
8. The Academic Consensus — What Research Tells Us
The academic literature on share dilution is rich and broadly consistent. Let’s summarise the key findings:
Myers and Majluf (1984) established the foundational theoretical framework: companies issue equity when management believes the stock is overvalued, creating a negative signal to the market. This is known as the Pecking Order Theory of capital structure, and it’s been validated empirically across dozens of studies.
Masulis and Korwar (1986) demonstrated empirically that seasoned equity offering announcements cause significant negative stock price reactions, with the magnitude of price decline linked to the size of the offering. Larger offerings = larger negative signal = bigger stock price drop.
Masulis & Korwar (1986) — Equity Issues and Offering Dilution (ScienceDirect)
Burkart and colleagues (2023) at the London School of Economics examined equity issuance across 41 countries and found that rights offerings (which give existing shareholders first opportunity) are associated with better wealth outcomes for existing shareholders compared to open public offerings. Investor protection laws in different jurisdictions significantly affect which method companies choose and how much shareholders are disadvantaged.
Burkart et al. (2023) — Equity Issuance Methods and Dilution (LSE Eprints / Oxford Academic)
The SPAC literature adds an important nuance. Gulliver and Scott (2024) argued that for SPACs, the dilutive effect of cash reduction through the de-SPAC process is often overstated, representing only about 5% dilution for non-redeeming shareholders — less than the typical 20% underpricing at a traditional IPO. This is a good reminder that context matters: not all dilutive structures are as damaging as headlines suggest.
Gulliver & Scott (2024) — No, SPACs Do Not Dilute Investors (Capital Markets Research)
The HBS paper analysing 224 major transactions between 1975 and 1994 found that EPS dilution does affect acquirer stock prices, but the effect is smaller than practitioners tend to assume — and is overwhelmed by the real economic effects of pricing the deal correctly and integrating the acquired company successfully. In other words: dilution matters, but execution matters more.
HBS (2000) — Do Appearances Matter? The Impact of EPS Accretion and Dilution on Stock Prices
9. Practical Toolkit — Resources and Tools for Tracking Dilution
Here are the practical resources every investor should have in their toolkit for tracking share dilution:
- SEC EDGAR (U.S.) / Companies House (U.K.): Primary source for all regulatory filings. Annual reports (10-K), quarterly reports (10-Q), and prospectuses (S-1, S-3, 424B) all contain share count data.
- Macrotrends / Wisesheets / Stockanalysis.com: These platforms chart historical share counts going back 10+ years. Free tools. Use them. There is absolutely no excuse for not knowing a company’s five-year share count trend.
- Company Annual Reports (Notes to Accounts): Never skip the notes. The share-based payment note, options outstanding, and convertible instrument disclosures live here. This is where the real story hides.
- Proxy Statements (DEF 14A): In the U.S., proxy statements disclose executive compensation, stock option grants, and any proposals to increase the authorised share count. A vote to increase authorised shares is often a precursor to dilution. Vote on it. Show up. Be counted.
One more thing: when a company you’re invested in announces a proposal to increase its authorised share count by hundreds of millions of shares “for general corporate purposes,” and there’s no specific immediate use stated — that’s your signal. That’s the company pre-loading the dilution cannon. They’re not going to tell you when they’ll fire it. But they’ve just told you it’s loaded.
10. Summary — The Dilution Checklist for Every Investor
THE TRADER’S DILUTION CHECKLIST
✅ Track the 5-year share count CAGR vs revenue and earnings CAGR
✅ Compare basic EPS and diluted EPS — note the gap
✅ Identify all convertible instruments, warrants, and option pools
✅ Calculate fully diluted market cap — not just basic market cap
✅ Check for ATM offering programmes and insider selling patterns
✅ Assess whether capital raised is being deployed for value creation
✅ Read the notes to financial statements — every time, no exceptions
✅ Flag recurring net losses funded by equity issuance as a major red flag
✅ Understand anti-dilution protections in any private market investments
✅ Vote on authorised share count increases — your vote matters
Share dilution is not a niche concept for accountants and CFOs. It’s a fundamental threat to investment returns that every single person who owns stocks needs to understand. The academic research is clear: equity issuance sends negative signals to the market, can systematically transfer wealth away from existing shareholders, and — when abused — destroys long-term investor value. The case studies are vivid: AMC Entertainment showed what predatory dilution looks like when a distressed company takes advantage of irrational market sentiment to issue shares at inflated prices. GameStop showed how the same mechanism can be used more responsibly to fund a genuine strategic pivot.
The metrics exist to catch it. The tools are free. The information is public. The only thing standing between you and getting diluted is whether you actually look.
So look. Read the footnotes. Track the share count. Calculate the fully diluted market cap. And the next time a CEO hops on an earnings call and says the word “accretive” seventeen times while share count is up 40% year-on-year, you’ll know exactly what’s happening. And more importantly, you’ll know what to do about it.
Because in this market, the uninformed shareholder is the pizza. The informed shareholder is the person who brought the boxes.
Don’t be the pizza.
References
- Masulis, R.W. & Korwar, A.N. (1986). Seasoned equity offerings: An empirical investigation. Journal of Financial Economics, 15(1–2), 91–118. https://doi.org/10.1016/0304-405X(86)90050-4
- Myers, S.C. & Majluf, N.S. (1984). Corporate financing and investment decisions when firms have information that investors do not have. Journal of Financial Economics, 13(2), 187–221.
- Burkart, M., Holmén, M., Koufopoulos, K., & Vlassopoulos, T. (2023). Equity issuance methods and dilution. Review of Corporate Finance Studies, 12(1), 78–122. https://academic.oup.com/rcfs/article/12/1/78/6673162 — LSE Eprints version: https://eprints.lse.ac.uk/117895/
- Huyghebaert, N. (2000). Do appearances matter? The impact of EPS accretion and dilution on stock prices. Harvard Business School Working Paper 00-007. https://www.hbs.edu/ris/Publication%20Files/00-007_d2f48676-86f0-4450-903f-9116c4d8e75c.pdf
- Chaumont, G., Gordon, G., & Sultanum, B. (2021). GameStop, AMC and the self-fulfilling beliefs of stock buyers. Federal Reserve Bank of Richmond Economic Brief, No. 21-13. https://www.richmondfed.org/publications/research/economic_brief/2021/eb_21-13
- Kim, K., et al. (2023). Social informedness and investor sentiment in the GameStop short squeeze. Electronic Markets, 33(1), 23. https://doi.org/10.1007/s12525-023-00632-9
- Pomparelli, T. (2024). The GameStop short squeeze as a case study in business law education. SSRN Working Paper. https://papers.ssrn.com/sol3/papers.cfm?abstract_id=4880888
- Gulliver, M. & Scott, R. (2024). No, SPACs do not dilute investors — a theoretical and empirical analysis. Capital Markets Research Working Paper. https://capmktsreg.org/wp-content/uploads/2024/07/Gulliver_Scott_SPACs-07.08.24.pdf
- TrueData (2025). Share dilution: Impact on shareholders & valuation explained. https://www.truedata.in/blog/share-dilution-impact-on-shareholders-valuation
- Nasdaq (2024). Stock dilution: Meaning, types, effects and risks. https://www.nasdaq.com/articles/stock-dilution-meaning-types-effects-and-risks
Disclaimer: This article was written for informational and educational purposes only. Nothing herein constitutes investment advice. Always conduct your own due diligence and consult a qualified financial professional before making investment decisions.
Leave a Reply
You must be logged in to post a comment.