A forensic, Graham-and-Buffett-style fundamental analysis of Space Exploration Technologies Corp following its June 2026 Nasdaq listing.
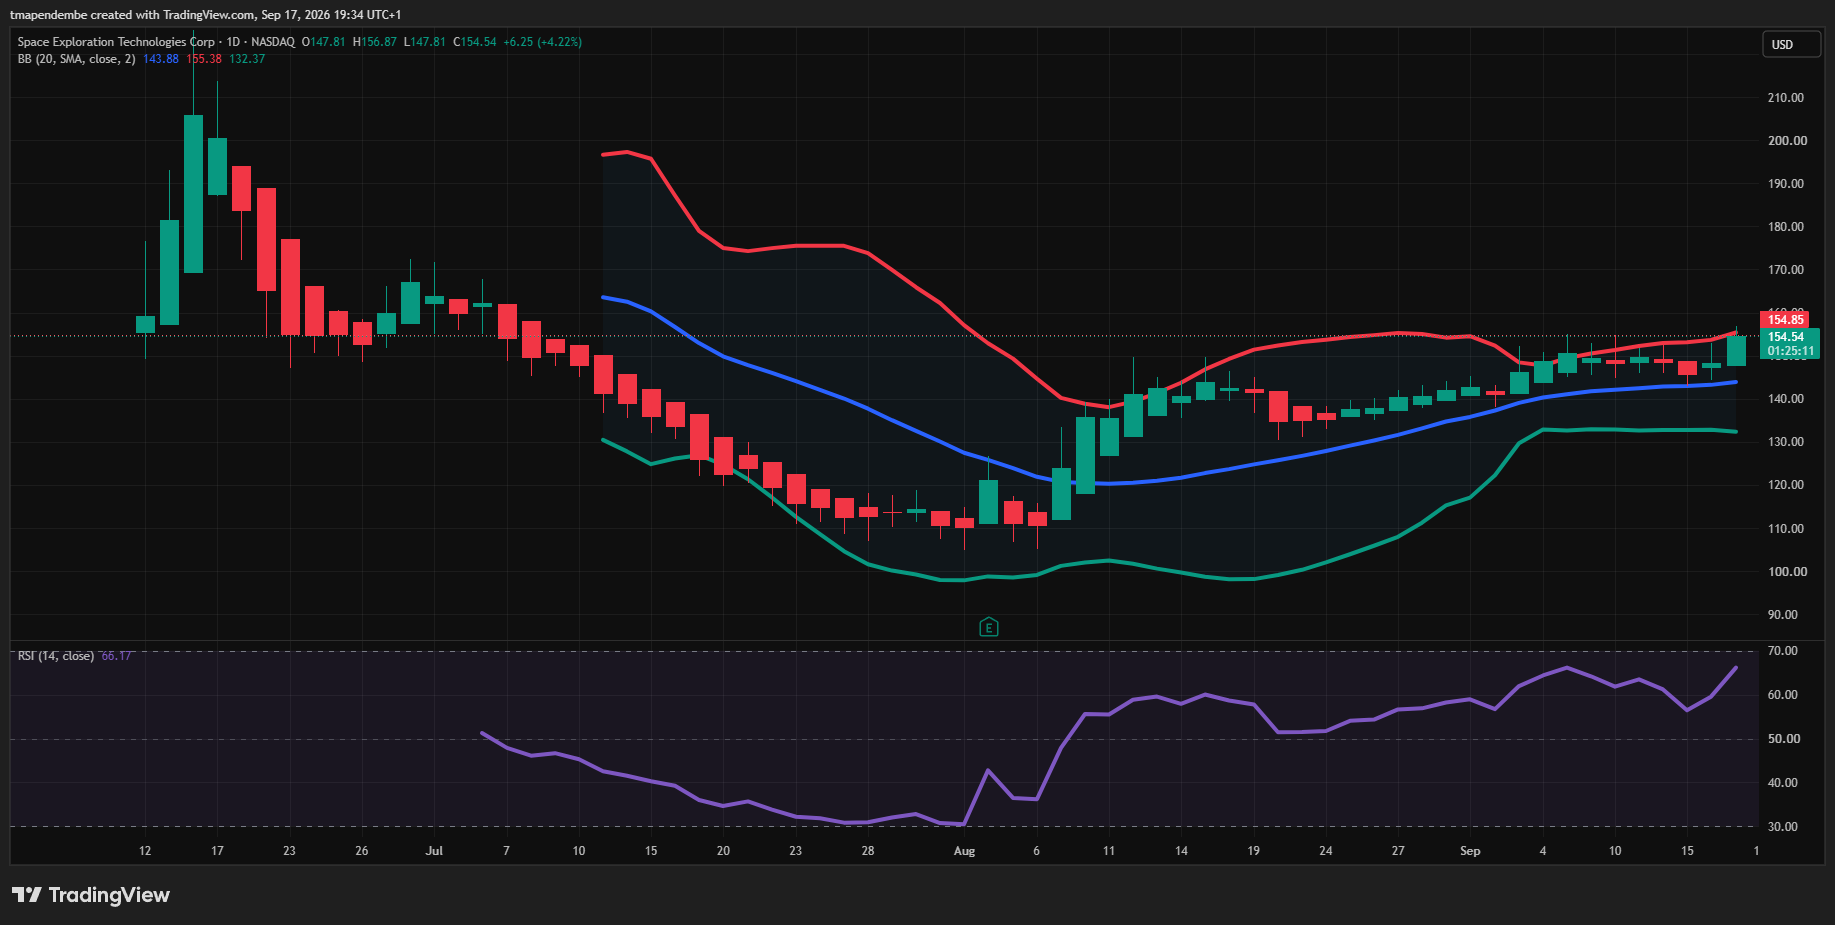
Current Price: ~$150 | IPO Price: $135 (June 12, 2026) | Approx. Market Cap: ~$2.0 trillion | Rating: SELL
SpaceX (NASDAQ: SPCX) combines a genuinely moated, profitable rocket and satellite business with a cash-burning AI segment, and currently trades at roughly 90–100x sales with negative free cash flow. Applying a conservative, Buffett-style valuation framework, this analysis concludes the stock is a Sell due to its lack of margin of safety, despite the narrow moat present in its core launch operations.
Preliminary Note on Data
SpaceX completed the largest IPO in history in June 2026, raising $75 billion at a $1.75 trillion valuation. Because the company has been public for barely three months, there is no five-year run of audited public financial statements — the analysis below reconstructs the required trend data from SpaceX’s SEC S-1 registration statement (FY2023–FY2025 and Q1 2026), cross-checked against contemporaneous reporting from Fortune, Satellite Today, and TradingKey. Where five-year trend data is genuinely unavailable (pre-IPO periods were not independently audited to public-company standard), this is flagged explicitly rather than estimated — consistent with Graham’s rule to avoid precision where none exists.
1. The Business Pillar: Understandability & Predictability
How it makes money. SpaceX now discloses three segments: Starlink (satellite broadband, ~61% of 2025 revenue), Space (Falcon 9/Heavy and Starship launch services, historically the founding business), and, since a 2025 corporate combination, an AI segment built around the Grok chatbot and enterprise/data-center contracts inherited from xAI. This is a critical structural fact: the equity investors are buying is no longer a “rockets and satellites” pure-play — it is a conglomerate that bundles a capital-intensive, credibly moated aerospace/telecom business with a cash-incinerating, highly competitive generative-AI business.
This fails the first test of Graham/Buffett “circle of competence” investing on two counts. First, satellite constellations and reusable orbital rockets are technologically complex and capital-intensive, with genuine execution risk (Starship has suffered public launch scrubs and failures). Second, the AI segment operates in one of the most competitively contested, capital-hungry, and unpredictable technology races in existence, competing against OpenAI, Google, Anthropic, and Meta — none of which is a business Buffett would call “predictable.”
Management & integrity. Elon Musk has been CEO since founding the company in 2002 and retains roughly 82% of voting control on approximately 42% economic ownership through a dual-class share structure — about as much “skin in the game” as any public-company founder in history. That is a genuine positive under Buffett’s ownership-mentality test. However, the capital allocation picture is mixed: the IPO itself was a $75 billion primary share issuance (dilutive to existing holders, not a return of capital), there have been no buybacks, no dividend, and the corporate combination that folded the loss-making xAI/Grok business into SpaceX’s public financials is a related-party capital allocation decision that materially increased consolidated losses — the kind of self-dealing risk Buffett explicitly warns shareholders to scrutinize. Governance is also concentrated to an unusual degree: a single individual holds effective veto power over the company while simultaneously running Tesla and X/xAI, creating meaningful key-person and conflict-of-interest risk.
2. The Moat Pillar: Sustainable Competitive Advantage
| Moat Type | Verdict | Evidence |
|---|---|---|
| Cost Advantage | Wide (Launch segment only) | Reusable Falcon 9 boosters give SpaceX a structural cost-per-kilogram-to-orbit advantage over ULA, Arianespace, and most state-run competitors — the closest thing to a genuine, durable Buffett-style moat in this business. |
| Brand/Pricing Power | Narrow | Starlink has demonstrated some pricing power (subscription ARPU near $140–155/month) and gross margin has reportedly improved from roughly 50% (2024) toward the mid-50s% (2025), a modestly positive trend — but this is drawn from limited disclosure and is not a long, audited five-year series. |
| Switching Costs | Narrow, and segment-dependent | Government/defense launch contracts carry high switching costs due to certification requirements (a real moat with NASA/DoD). Consumer Starlink subscriptions, by contrast, are month-to-month with low switching costs — a weak moat at best. |
| Network Effects | None | Satellite bandwidth is a shared, finite resource; more subscribers do not make the service structurally better for existing users the way a true two-sided network does. This is frequently mis-marketed as a “network effect” but functions more like an economies-of-scale cost curve. |
| AI Segment (Grok/xAI) | None | A commoditizing market with several well-capitalized rivals and no demonstrated durable advantage; it is currently a large cash sink, not a moat contributor. |
Overall moat rating: Narrow. The core Space/Starlink business has real, defensible advantages; the consolidated public entity that investors actually buy shares of does not, because the AI segment dilutes the group’s overall competitive and financial quality.
3. The Financial Pillar: The Numbers
| Metric (Consolidated) | FY2023 | FY2024 | FY2025 | Q1 2026 |
|---|---|---|---|---|
| Revenue | $10.39B | $14.02B | $18.67B | $4.69B |
| Revenue growth YoY | — | +35% | +33% | — |
| Loss from operations | n/a (disclosure limited) | n/a | -$2.59B | -$1.94B |
| Net income (loss) | n/a | Reported positive pre-combination | -$4.94B | -$4.28B |
| Adjusted EBITDA | n/a | n/a | $6.58B (35% margin) | $1.13B (24% margin) |
| Accumulated deficit | — | — | — | $41.31B (as of 3/31/26) |
Source: SEC S-1; Morningstar.
- ROIC / ROE: Both are negative on a trailing basis given the $4.94B FY2025 net loss and an even larger Q1 2026 quarterly loss of $4.28B. This is an immediate, disqualifying red flag under Buffett’s 15%+ ROIC/ROE threshold — there is no ambiguity here, the company is currently destroying accounting capital at the consolidated level, driven almost entirely by the AI segment’s 2025 operating loss of roughly $6.36B against 2025 AI-segment capex of about $12.7B.
- Debt health: Total debt is approximately $30.3B (LT debt ~$28.7B) against total cash of ~$15.9B, for a Debt-to-Equity ratio of 0.89 — moderate, not extreme, on paper. But Buffett’s real test is whether free cash flow could retire that debt within 3–4 years. Trailing-twelve-month free cash flow is negative $19.8B (operating cash flow of $7.1B against capex of $26.9B). On current trajectory, the company cannot pay down debt from operations at all — it is currently a net consumer, not a source, of cash, financed instead by $33.1B of TTM financing inflows (new debt and the IPO itself). This fails the debt-coverage test outright.
- Margins: Segment-level gross margins in the profitable units (Starlink, Launch) appear healthy and improving (~50–55%), but the consolidated net margin was approximately -26% in FY2025 (-$4.94B / $18.67B), worse than 2024. There is no five-year trend of stable-or-expanding consolidated net margins to point to — the only trend visible is deterioration since the AI segment was folded in.
Financial Pillar verdict: Fails. Every one of Buffett’s core financial screens — ROIC, ROE, FCF-to-debt coverage, and consolidated margin trend — currently fails, despite the underlying launch and satellite units generating real segment profits.
4. The Valuation Pillar: Margin of Safety
- P/E, Forward P/E, PEG: All not meaningful — the company has a GAAP net loss, so no trailing or forward P/E exists, and PEG cannot be computed without positive, trending earnings.
- Price/Sales: At the $135 IPO price, SPCX was valued at roughly 94x FY2025 revenue and about 266x FY2025 adjusted EBITDA, according to TradingKey’s breakdown of the S-1. At the current ~$150 share price and ~$2.0 trillion market cap, the multiple is modestly higher still — well outside historical ranges for either aerospace (typically 2–6x sales) or high-growth cloud/AI infrastructure businesses (typically 10–20x sales).
Conservative 2-stage DCF (illustrative, Buffett-style 10% discount rate):
Because trailing FCF is deeply negative, a defensible DCF must model a path back to positive free cash flow rather than assume it already exists — the conservative approach Graham/Buffett would insist on.
Assumptions: Revenue growth decelerating from 25% (Year 1) to 10% (Year 5); FCF margin improving from -40% (Year 1, reflecting continued heavy Starship/Starlink v3/AI-datacenter capex) to +10% (Year 5, as capex intensity normalizes); 3% terminal growth.
| Year | Revenue ($B) | FCF Margin | FCF ($B) | PV @ 10% ($B) |
|---|---|---|---|---|
| 1 | 23.3 | -40% | -9.34 | -8.49 |
| 2 | 28.0 | -20% | -5.60 | -4.63 |
| 3 | 32.2 | -5% | -1.61 | -1.21 |
| 4 | 36.1 | +5% | 1.80 | 1.23 |
| 5 | 39.7 | +10% | 3.97 | 2.47 |
Sum of PV (Stage 1) ≈ -$10.6B. Terminal value (Gordon Growth on Year-5 FCF, 3% perpetual growth) ≈ $58.4B, discounted to present ≈ +$36.3B. Enterprise value ≈ $25.7B. Adjusting for net debt (~$14.4B net debt) gives an implied conservative equity value of roughly $11B, versus a current market capitalization of approximately $2.0 trillion.
Margin of Safety: Deeply negative. Even allowing for the fact that this DCF almost certainly understates the standalone value of the profitable Starlink and Launch segments (a sum-of-the-parts approach using, say, 8–12x segment EBITDA on the profitable units alone might reasonably support a valuation in the low hundreds of billions), no plausible conservative reconstruction closes a gap measured in trillions of dollars. The market is pricing SPCX for flawless, sustained hyper-growth execution across three segments simultaneously — the opposite of a margin of safety.
Final Output & Rating Conclusion
1. Economic Moat Rating: Narrow. The Space/Launch segment has a genuine, wide cost-advantage moat via reusable rockets; the consolidated public entity is diluted to “narrow” because the AI segment has no moat and Starlink’s switching costs are low.
2. Intrinsic Value Estimate: ~$1–2 per share (conservative consolidated DCF) vs. Current Price of ~$150.00. Even generous sum-of-the-parts adjustments for the profitable segments would not close more than a small fraction of this gap.
3. Final Investment Rating: SELL. This is not a verdict on SpaceX’s engineering achievements, which are real and historically important — it is a verdict on price. The stock fails the valuation pillar so decisively (negative consolidated ROIC/ROE, negative free cash flow, ~90–100x sales, no margin of safety by any conservative measure) that it meets the Sell threshold regardless of the narrow moat present in the core launch business.
4. Key Risks (Top 2 Catalysts That Could Break the Thesis Further or Validate a Recovery):
- AI segment cash burn. The Grok/xAI segment lost roughly $6.36B from operations in 2025 against ~$12.7B of AI-related capex. If this burn rate does not decelerate, it will continue to consume cash generated by the profitable Starlink and Launch segments indefinitely, delaying any path to consolidated profitability.
- Government concentration and key-person risk. Roughly $5.9B of 2025 revenue came from U.S. government contracts (NASA, DoD, intelligence agencies), exposing the company to political and procurement risk, while Musk’s 82% voting control concentrated across multiple companies (Tesla, X, xAI) creates unusual governance and conflict-of-interest exposure for minority shareholders.
This report is for informational and educational purposes only and does not constitute investment advice. All figures are drawn from public disclosures current as of September 2026 and are subject to change as SpaceX reports further quarterly results.
Leave a Reply
You must be logged in to post a comment.